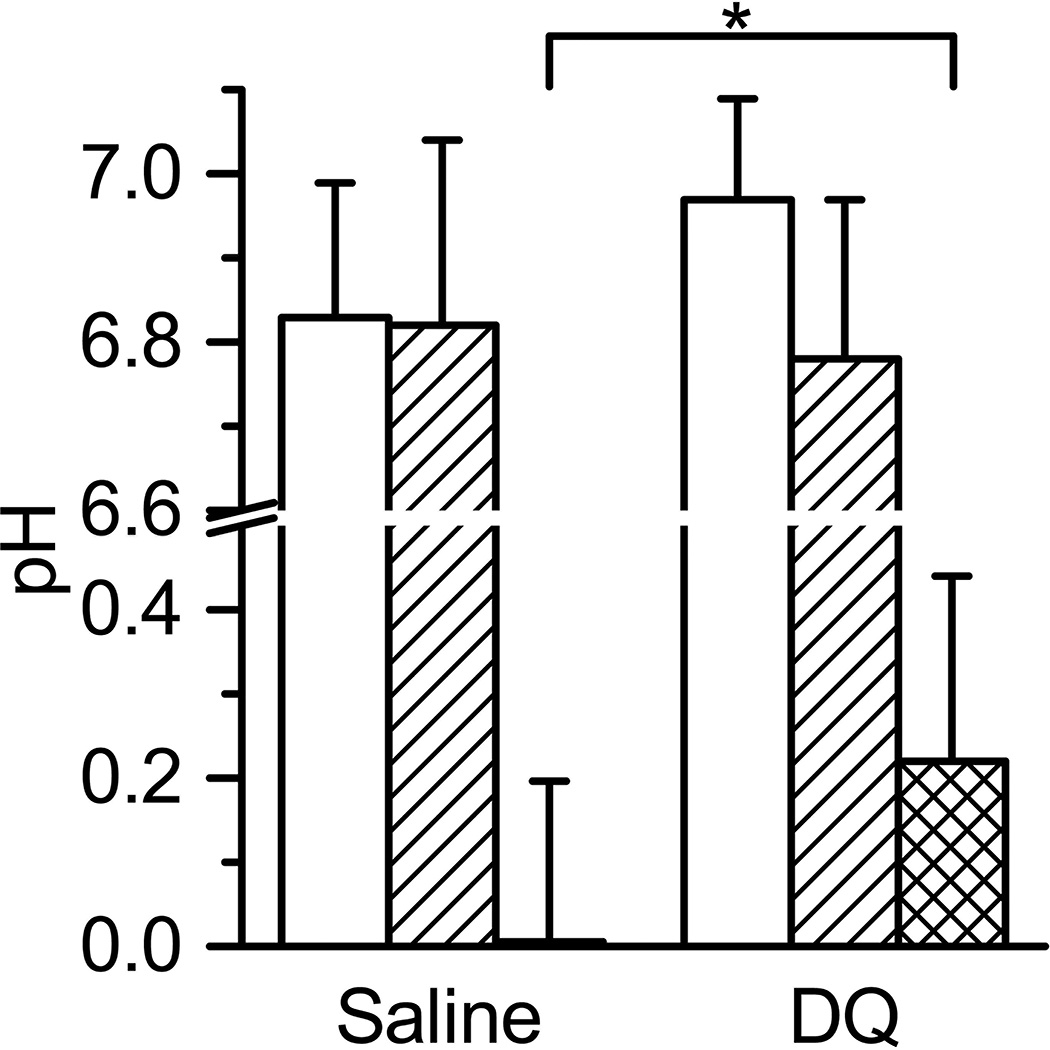
Figure 6.
The acidity values of tumor tissue measured by NR soluble probe before (white columns) and 60 min after saline or DQ i.v. tail vein injections (crossed columns). Double crossed columns shows the change in pHe. Animals were not thermoregulated. Number of animals was 11 and 8 for saline and DQ experiments, correspondingly. Average tumor volume was (57±31) µL and (77±33) µL for saline and DQ experiments, correspondingly. Errors are SD values. *p <0.04.

