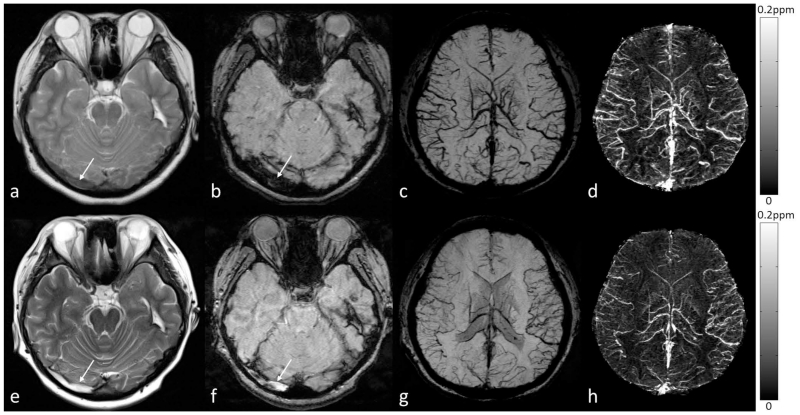
Figure 11.
Visualization and quantification of the susceptibility of bilateral cortical veins in a 19-year-old female patient with right transverse sinus thrombosis. The right transverse sinus is less hypo-intense than normal on T2WI (a) and markedly hypo-intense and dilated on SWI (b), suggestive of early thrombosis. Bilateral cortical veins were dilated and increased levels of deoxyhemoglobin were indicated on the minimum intensity projection (mIP) of the SWI data (c) and the maximum intensity projection (MIP) of the QSM data (d). In the follow-up scan, both the T2WI (e) and the original magnitude image in the SWI data (f) showed hyper-intensity in the right transverse sinus, possibly due to evolving blood products in the thrombus (white arrows). Although a normal flow void did not return on T2WI, the increased oxygen saturation of the cortical veins may suggest early recanalization or collateral venous drainage in the brain, as indicated by both the mIP of SWI data (g) and the MIP of QSM data (h). For a to d, the original data were acquired at 1.5T (where the echo time of the SWI data was 40ms); while for e to h, the original data were acquired at 3T (where the echo time of the SWI data was 20ms). Susceptibility maps in d and h were generated using a truncated k-space division algorithm (64) with a k-space threshold 0.2. The effective slice thickness is 24mm in c, d g, and h.

