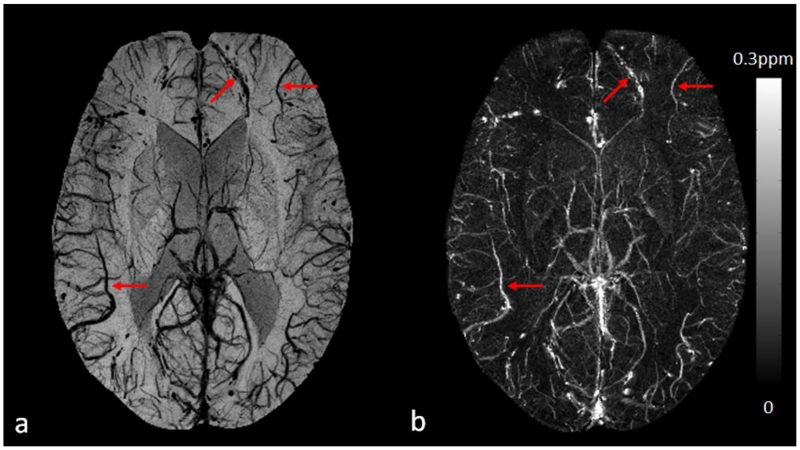
Figure 13.
Visualization and quantification of cortical veins on SWI (a) and QSM (b) in a 32-year-old male patient with diffuse axonal injury due to a traffic accident. The cortical veins near the cerebral microbleeds can be clearly seen in the frontal and parietal lobes (red arrows). Susceptibility maps were generated using the geometry constrained iterative SWIM algorithm (65).

