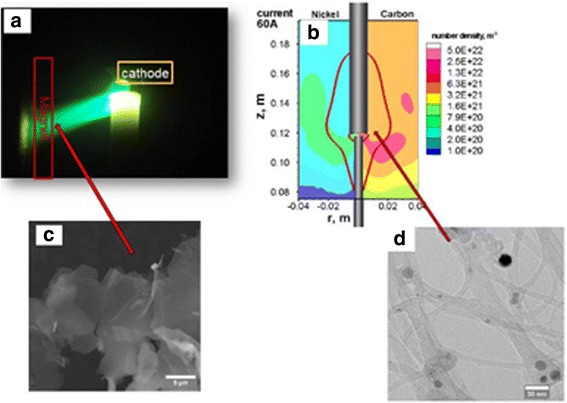
Fig. 9.

Photo of the applied magnetic field at arc plasma (a), computed carbon and catalyst particle density distribution showing the regions with preferable conditions for chiral CNT synthesis (b), scanning electron microscope image of graphene sheets (c), and TEM image of SWCNT bundles with specific chirality (d). The figures are adapted with permission from Institute of Physics Science [166]
