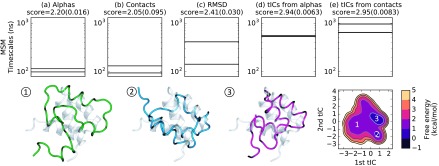
FIG. 5.
Time scale plots for two-time scale MSMs generated for homeodomain (PDB ID: 2p6j) using the best model from each of five different featurization choices (a)-(e) show that kinetics are highly sensitive to the featurization choice. All models were made using mini-batch k-medoids clustering. Standard deviations for model scores generated from five cross-validation iterations are given in parentheses, and the thickness of each horizontal lines corresponding to estimated time scales represents two standard deviations in both directions from the estimate. The kinetics feature slower processes for better models; notably, the slowest time scale predicted by the best model is an order of magnitude slower than that predicted by the worst model. A free energy landscape for model (e) was created from its first two tICs. Structures sampled from the dataset (1-3) represent different regions on the free energy surface of model (e). Each sampled structure is an α-carbon trace superimposed upon the crystal structure. The first tIC (regions 1 3) appears to track the formation of secondary structure, while the second tIC (regions 2 3) corresponds to the aligning of α-helices.

