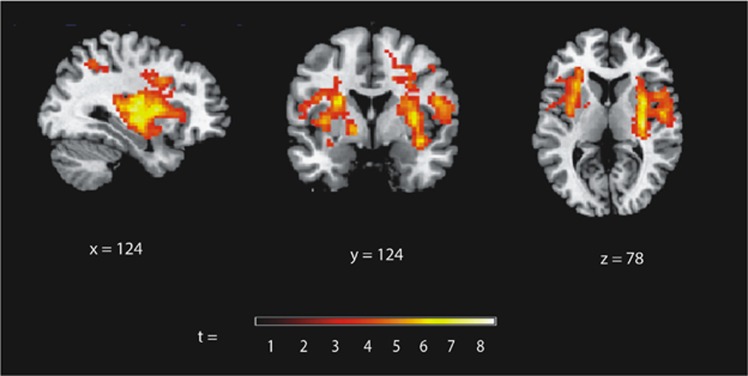
Figure 1.
Increased fractional amplitude of low-frequency fluctuations (fALFF) in severely obese compared with normal-weight participants (independent of food intake, covaried for subjective stress levels). Significant differences in fALFF are illustrated on a template brain, showing sagittal (x), coronal (y) and axial (z) view, and the slice number in each dimension. The color bar illustrates t-value scores represented by activation clusters on the brain map based on a t-threshold value >t=3.3.

