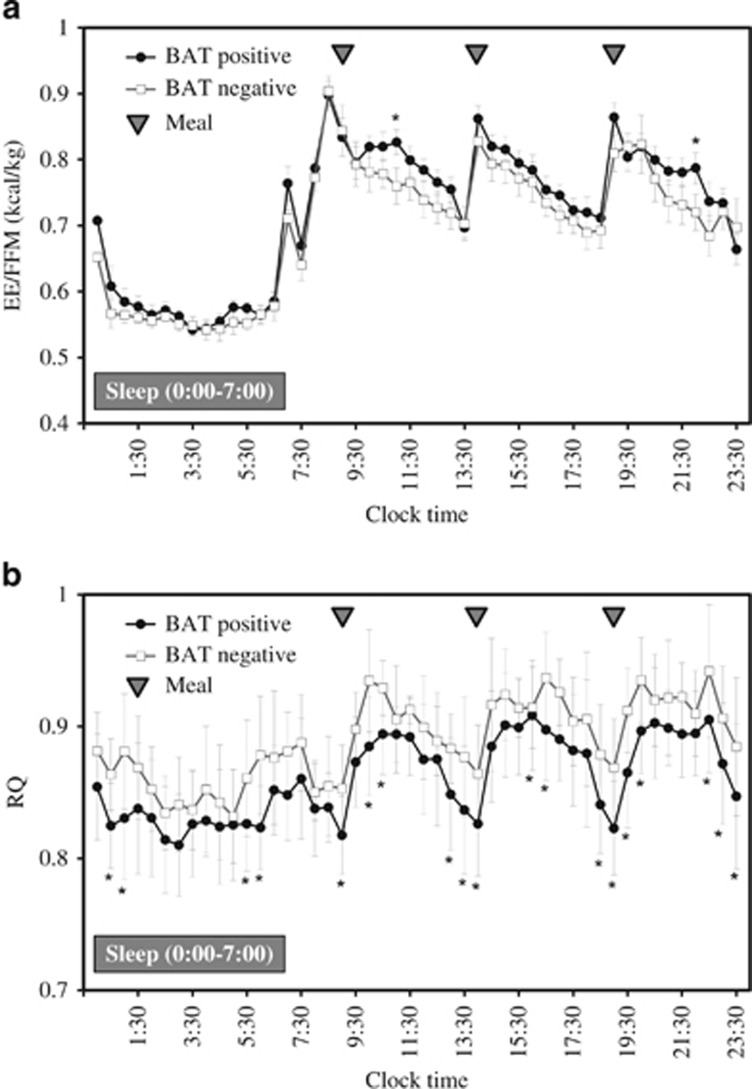
Figure 2.
Changes in (a) energy expenditure (EE) per fat free mass (FFM) and (b) RQ during 30-min intervals in a whole-room indirect calorimeter for 24 h. Data are expressed as value per hour±s.e. Black circles with black lines represent the BAT-positive group (n=13) and the white squares with black lines represent the BAT-negative group (n=8). Grey triangles represent the meal times (0900, 1400 and 1900 hours). (A) ANOVA showed that EE/FFM over 24 h varied with group and time as demonstrated by the lack of a significant effect of group (P=0.339), but a significant effect of time (P<0.001) and a group × time interaction (P=0.010). (b) ANOVA showed that RQ over 24 h varied with group and time as demonstrated by the significant effect of group (P=0.029) and the significant effect of time (P<0.001), but no significant group × time interaction (P=0.010). * significantly different from BAT-negative group (P<0.05, without corrections for multiple comparisons).

