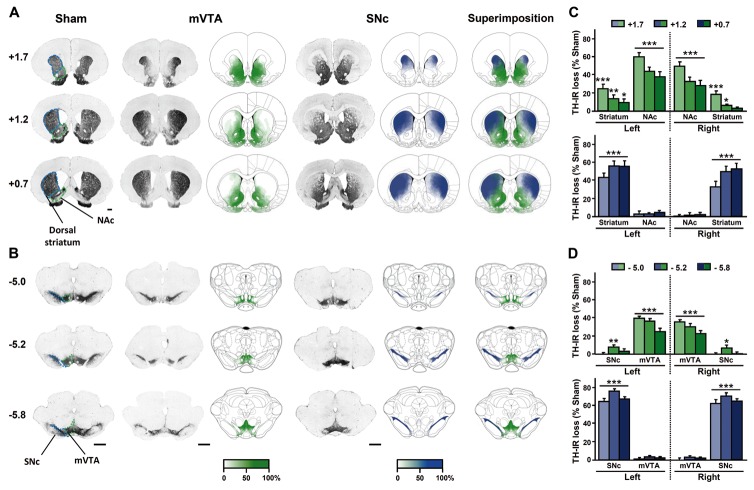
Fig. 1. Bilateral partial lesions of the mVTA or SNc result in distinct, non overlapping, complementary patterns of DA depletion throughout striatal territories.
(A and B) Representative photomicrographs of coronal sections stained for TH in striatal (+1.7 to 0.7 mm anterior to bregma) (A) and mesencephalic (−5 to −5.8 mm anterior to bregma) (B) regions according to the stereotaxic atlas of Paxinos and Watson36, 37. Bar = 1 mm. The intensity of the gradient of color (white to green or white to blue) in schematic sections corresponds to the measured DA lesioned area in the different brain structures studied for each lesion performed. mVTA lesion are shown in green and SNc lesion in blue. The highest intensity of green or of blue color (100%) indicates that all animals had lesions in the corresponding area, whereas the lowest color intensity (white, 0%) corresponds to a non lesioned or denervated area. (C and D) Quantification of the loss of TH staining in the different mesencephalic (C) and striatal (D) structures, expressed as percentage of the mean value obtained for sham-operated animals. Two-way ANOVAs revealed significant interactions between the lesion and the brain region considered (Fs > 9.49, Ps < 0.001). n = 22–28, *P < 0.05, **P < 0.01, ***P < 0.001. mVTA, medial ventral tegmental area; NAc, nucleus accumbens; SNc, substantia nigra pars compacta.

