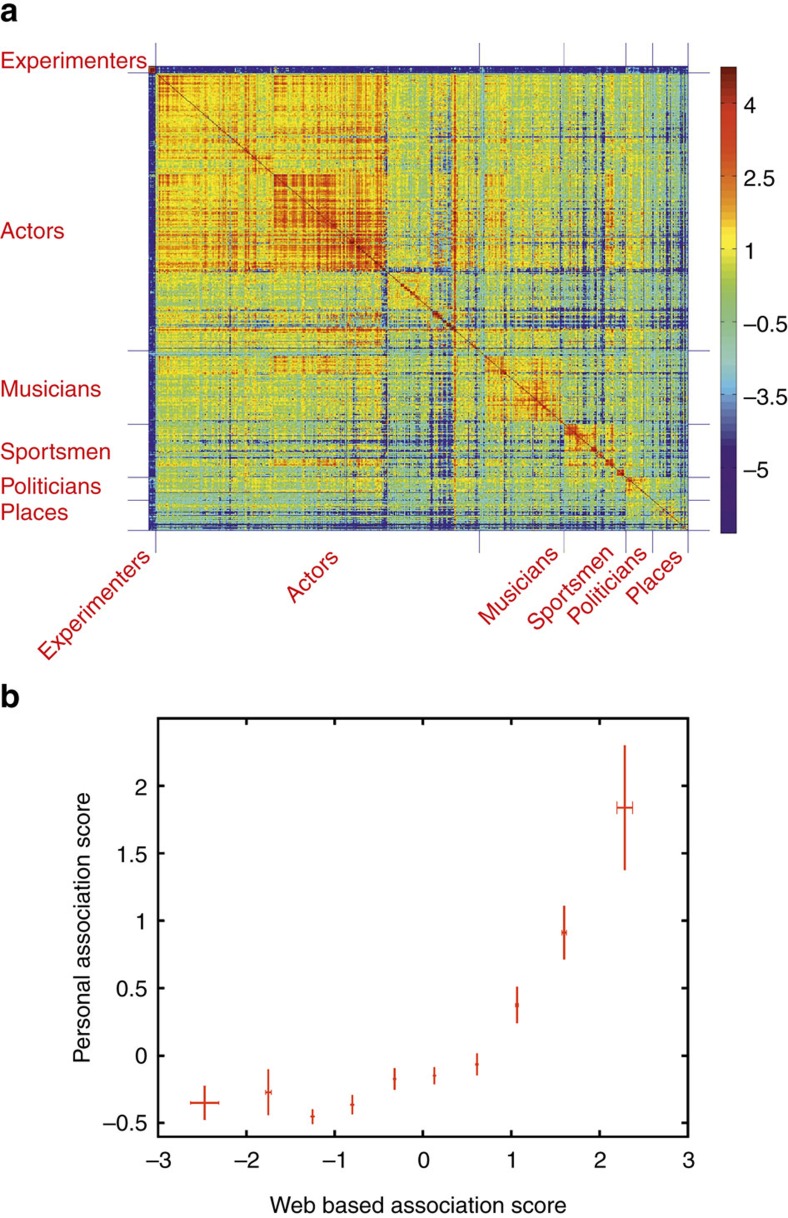
Figure 2. Web-association matrix and correlation with personal scores.
(a) Web-association values between the 611 stimuli presented in the screening sessions. Note the clustering of values according to the broad categories of the images (manually assigned categories are shown on the left/bottom). The colour bar on the right shows the strength of association values in arbitrary units. (b) Correlation between the personal and the web-based association scores (see text for details; mean±s.e.m.).

