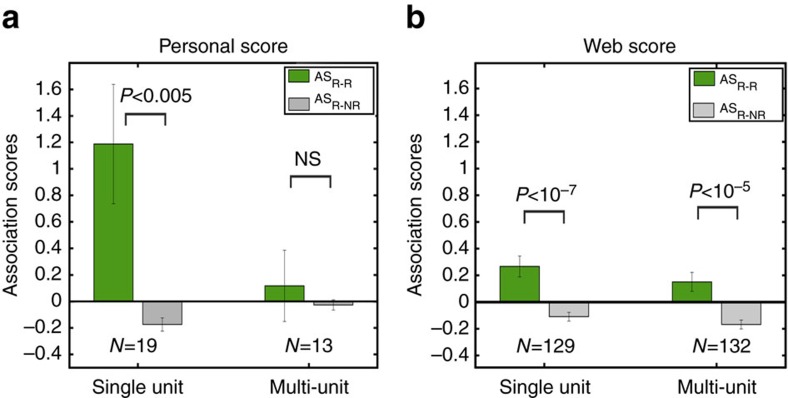
Figure 3. Mean association values with personal and web-based scores.
(a) Mean association score for the pairs of pictures to which the neuron fired (ASR-R; green) and for the other pictures pairs (ASR-NR; grey) based on the patients' scores. (b) Same as a but considering a larger set of responses using the web-based association scores.

