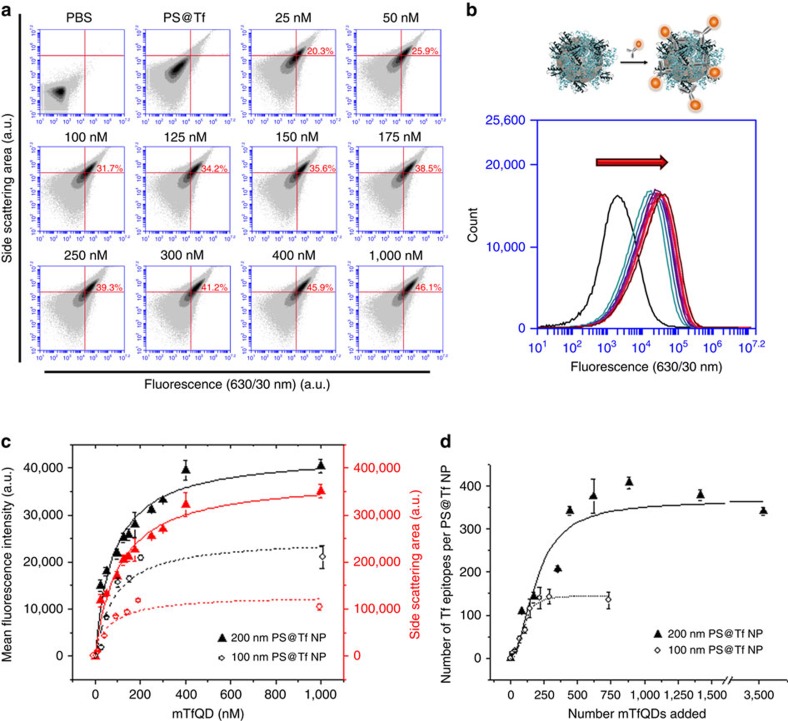
Figure 2. Flow cytometry data analysis of PS@Tf nanoparticles labelled with immunoprobes (mTfQD630).
(a) Scatter density plots of fluorescence signal versus side scattering area of a 200 nm PS@Tf nanoparticle solution (8.5 × 10¹⁰ PS@Tf nanoparticles·per ml) with increasing mTfQD630 concentration. (b) Histograms represent the mean fluorescence of each sample of PS@Tf nanoparticle labelled with increasing concentration of immunoprobe mTfQD630. (c) Fitting analysis of the mean fluorescence signal (in black) and side scattering area signal (in red) of 200 nm PS@Tf nanoparticles (triangles), 8.5 × 10¹⁰ nanoparticles·per ml, and 100 nm PS@Tf nanoparticles (circles), 8.2 × 10¹¹ nanoparticles·per ml, versus the concentration of mTfQD630 added. Data represent the mean fluorescence intensity of PS@Tf nanoparticles labelled with QDs±s.d. of three independent replicates. (d) Fitting analysis of the mTfQD630 attached to the PS@Tf nanoparticles versus the total number of mTfQD630 added. The total number of Tf epitopes labelled by mTfQD in the 200 nm polystyrene nanoparticle is 364±27 and 144.9±10 for the 100 nm polystyrene nanoparticle. Data represent the number of Tf epitopes labelled with mTfQDs±s.d. of three independent replicates.

