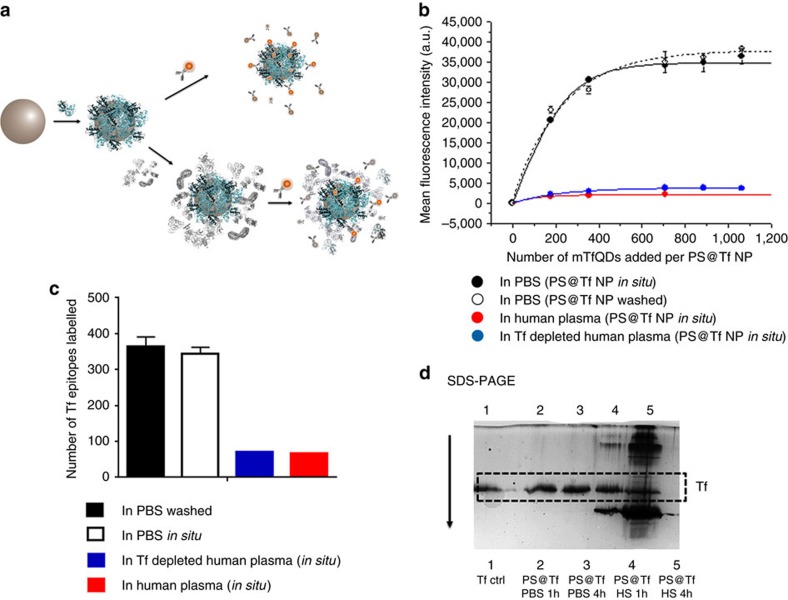
Figure 4. In situ mapping of Tf epitopes on protein corona of PS@Tf nanoparticle system.
(a) Schematic representation of PS@Tf nanoparticles in situ labelled with mTfQD630 in presence of 50% human plasma and in PBS buffer as a control. (b) Flow cytometry data analysis of PS@Tf (8.5 × 10¹⁰ PS@Tf nanoparticles·per ml) in situ labelled with mTfQD630. The samples were analysed without any purification steps in PBS buffer (black line, a control sample after washing the excess of QDs is shown in broken line), human plasma (red line) and Tf depleted human plasma (blue line) after incubation with mTfQD for 1 h. Data represent the mean fluorescence intensity of nanoparticles labelled with QDs±s.d. of two independent replicates. (c) Number of Tf epitopes labelled with mTfQD at the saturation point for the recognition under different media (PBS buffer, human plasma and Tf depleted human plasma). About 5% of the total amount of epitopes are detected after the particles are dispersed in complex media. Data represent the total number of epitopes labelled with QDs±s.d. of two independent replicates. (d) SDS-PAGE analysis of the Tf immobilized on the polystyrene nanoparticle surface when the particles are incubated in PBS buffer or human plasma for 1 and 4 h.

