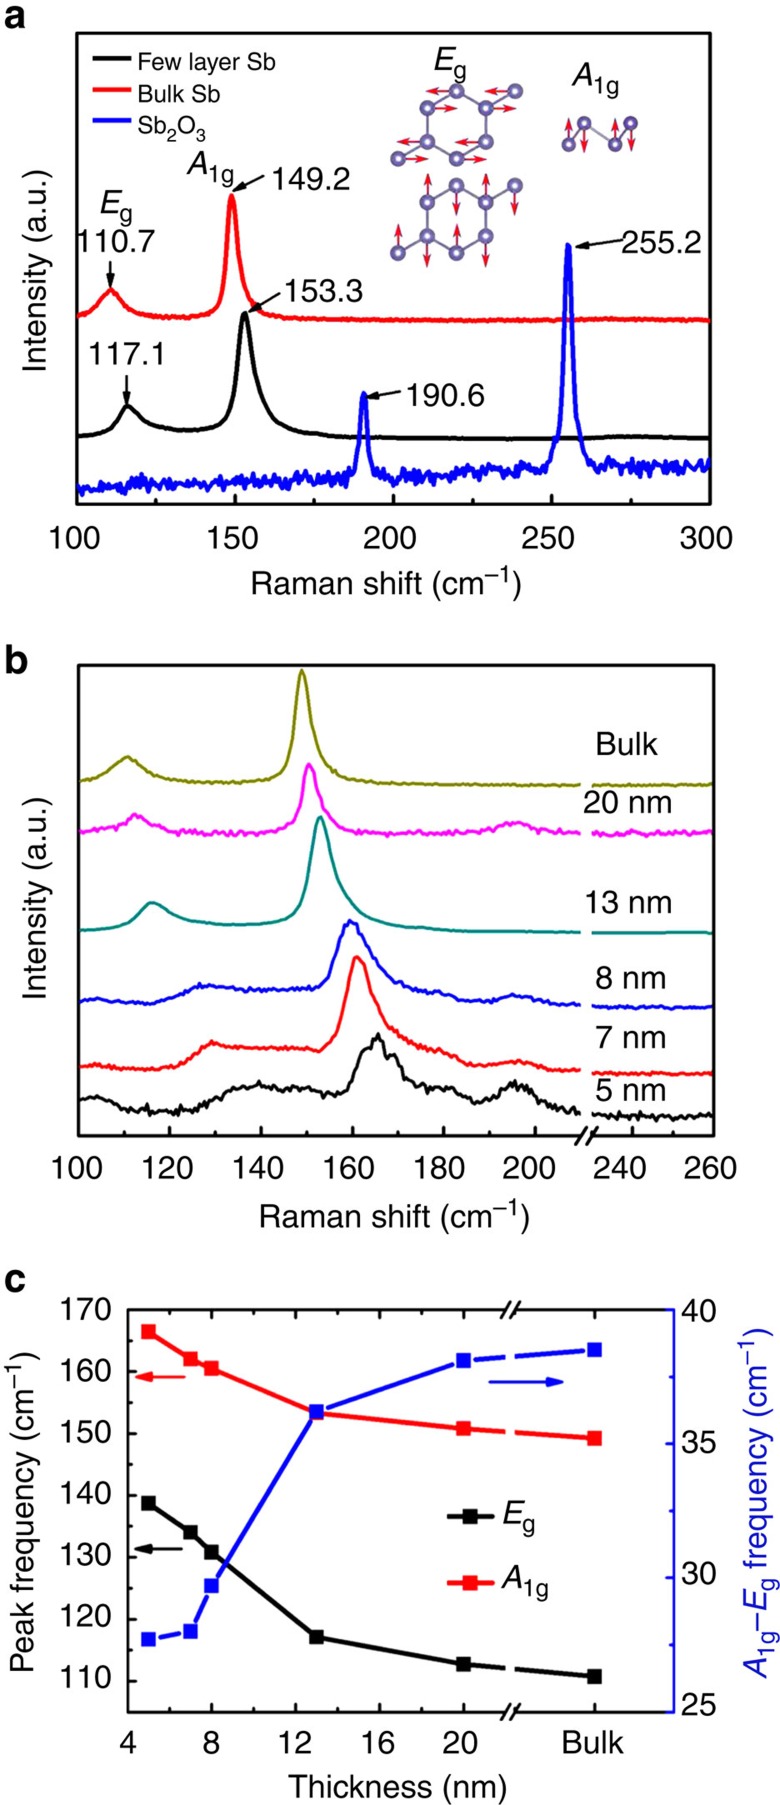
Figure 3. Raman spectroscopy of antimonene polygons.
(a) Raman spectra of bulk antimony (β-phase), few-layer antimonene and antimony trioxide. Inset: the vibrational modes of β-phase antimonene. (b) Raman spectra of antimonene polygons with thicknesses varying from 5 nm to bulk. (c) A1g, Eg peak frequencies (left vertical axis) and the energy difference (right vertical axis) of those two peaks plotted against sample thickness. The energy difference between the A1g and Eg peaks increases monotonically with sample thickness.

