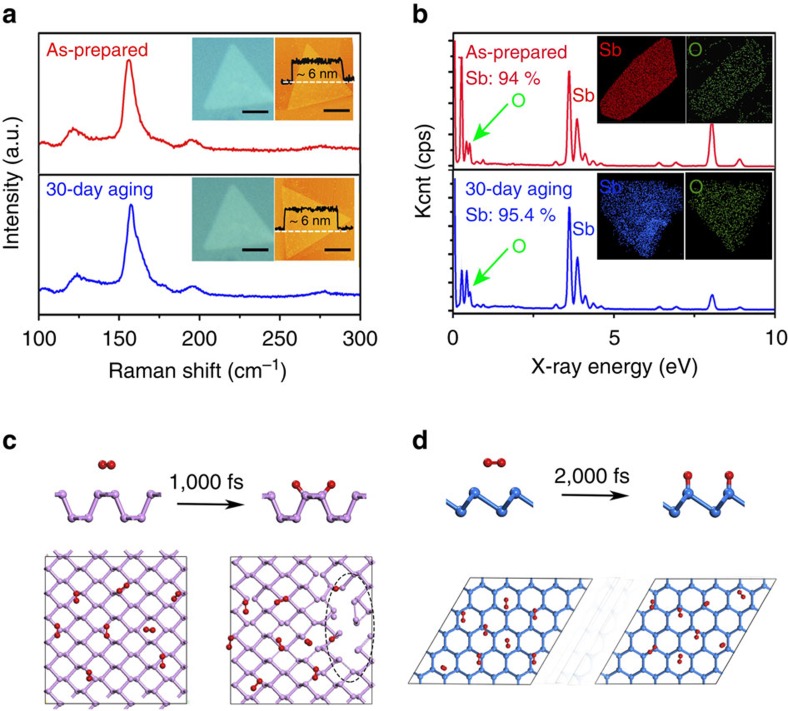
Figure 4. Stability verification via experiments and simulations of antimonene compared with BP.
(a) Optical images, AFM images and Raman spectra of antimonene layers before and after a 30-day aging. The scale bar is 2 um. (b) EDS analysis of antimonene sheets randomly selected om the copper grid before and after a 30-day aging. (c) Atomic structure of phosphorene oxide (O=P2D=O) and time-dependent snapshots of the configurations revealing interaction of O2 with phosphorene. (d) Atomic structure of phosphorene oxide (O=Sb2D=O) and time-dependent snapshots of the configurations revealing interaction of O2 with antimonene.

