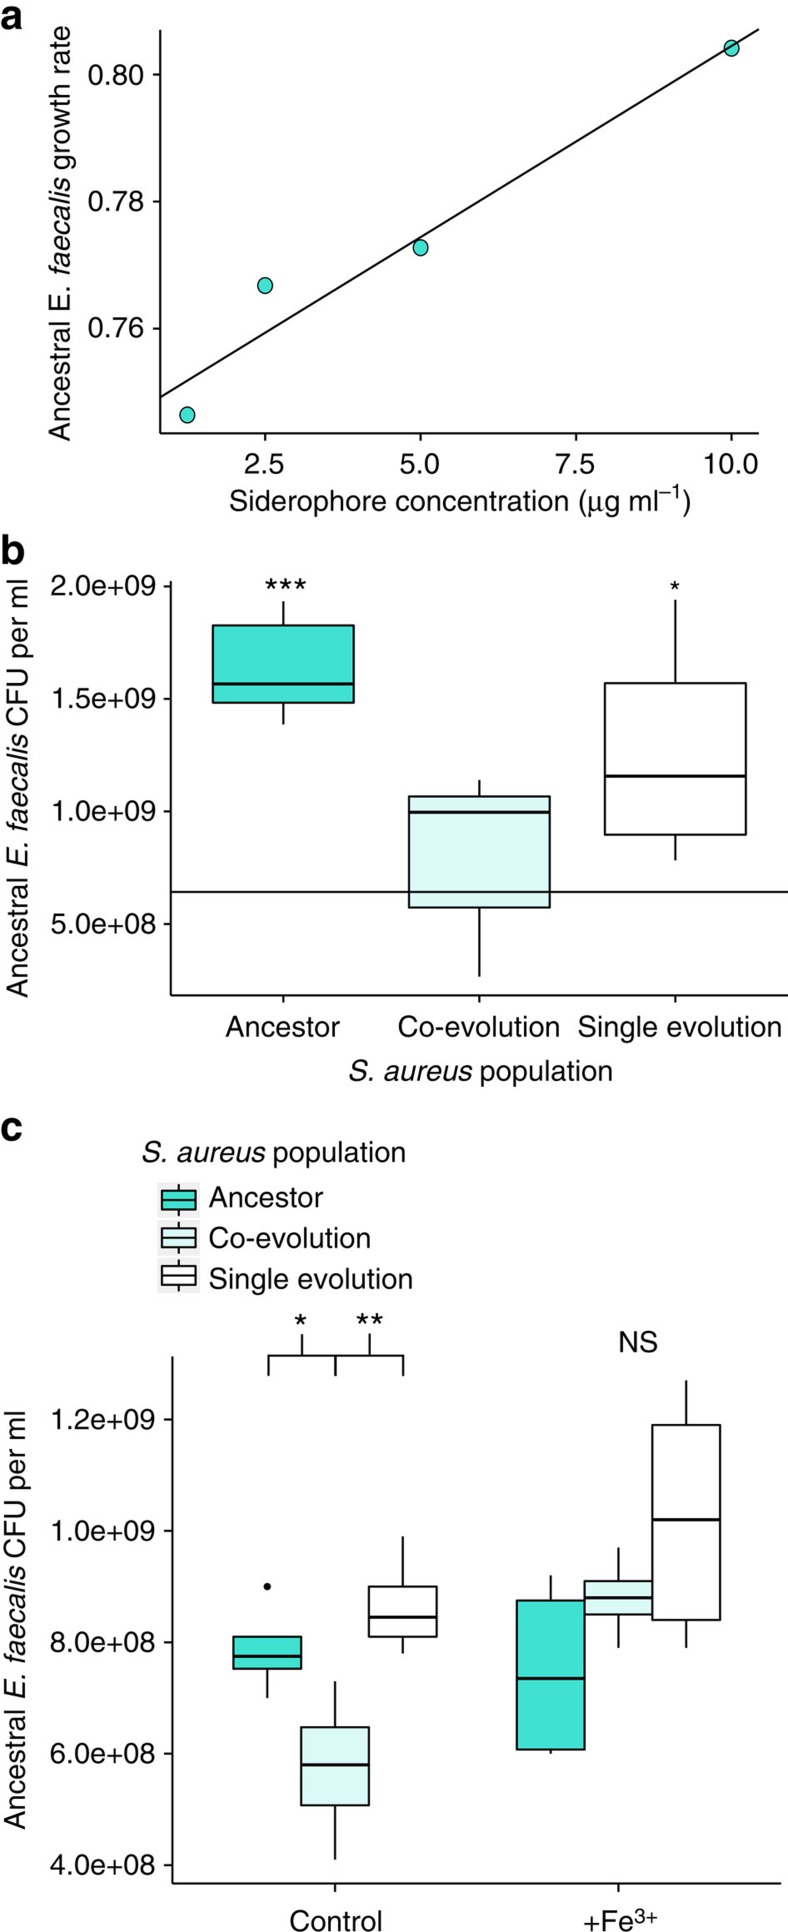
Figure 7. Effect of siderophores on defensive microbe fitness.
(a) Exogenous siderophore concentration (μg ml−1) against growth rate of ancestral E. faecalis in vitro. Pearson's product-moment correlation: t=6.1, df=2, P=0.026, R2=0.95. Sample size: one biological replicate for each concentration (average of two technical replicates). (b) Fitness of ancestral E. faecalis (CFU ml−1) after 24 h growth in vitro with ancestral or evolved S. aureus. The black line indicates the average fitness of E. faecalis in the absence of S. aureus. Statistical comparisons are made between this black line and each treatment. ANOVA: F=9.2, df=3, P=0.0009. Dunnett contrasts: co-evolution S. aureus and ancestral E. faecalis versus ancestral E. faecalis: P=0.77; single evolution S. aureus and ancestral E. faecalis versus ancestral E. faecalis: P=0.023; Ancestor S. aureus and ancestral E. faecalis versus ancestral E. faecalis: P<0.001. Sample size for each treatment: five biological replicates (one technical replicate). (c) Fitness of ancestral E. faecalis (CFU ml−1) after 24 h growth in vitro with ancestral or evolved S. aureus with (+Fe3+) and without (control) surplus iron. Control ANOVA: F=8.1, df=2, fdr corrected P=0.019. Tukey contrasts: Ancestor versus co-evolution: P=0.046; Single evolution versus co-evolution: P=0.009; single evolution versus ancestor: P=0.57. +Fe3+ ANOVA treatment: F=3.05, df=2, fdr corrected P=0.092. Sample size for each treatment of both ANOVAs: five biological replicates (one technical replicate). *P<0.05, **P<0.01, ***P<0.001.

