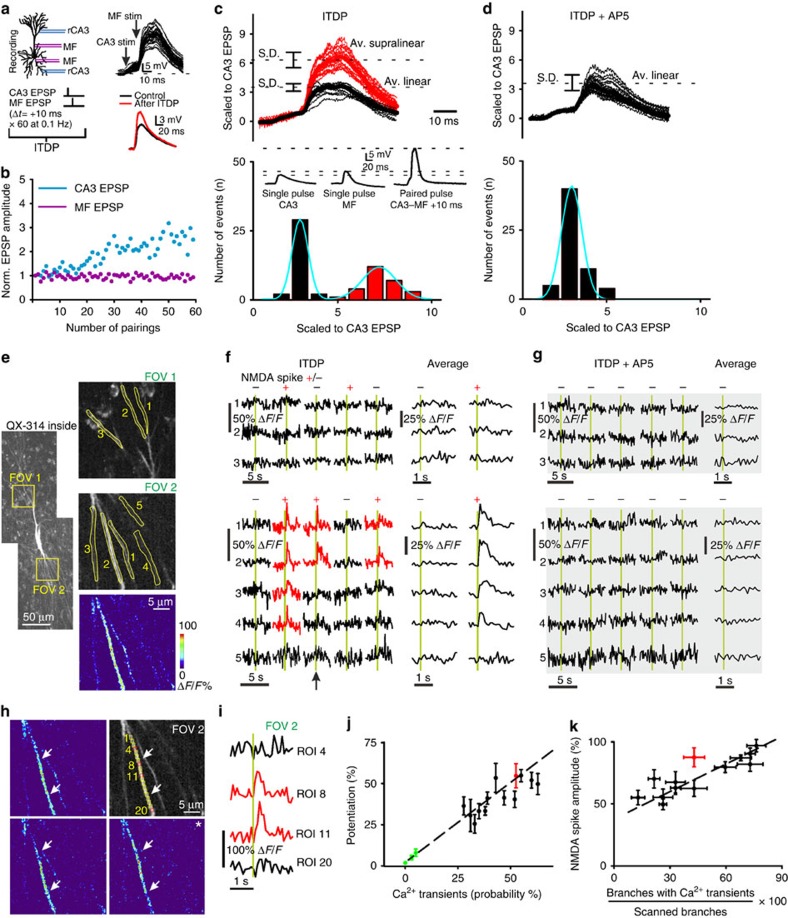
Figure 1. Branch-specific NMDAR-dependent dendritic Ca2+ transients evoked by subthreshold synaptic pairing are associated with LTP induction.
(a) Left: ITDP protocol for pairing rCA3 and MF inputs to a hippocampal CA3 pyramidal cell in slice culture. The recording pipette contained 500 μM QX-314. Right: representative example of pairing-evoked EPSPs and averaged traces of the rCA3 EPSP before and after LTP. (b) Time course throughout the pairing protocol of EPSP amplitudes normalized to baseline. rCA3-evoked but not MF-evoked EPSPs are potentiated. (c) Representative example of scaled voltage traces (normalized to initial rCA3 EPSP amplitude) reveal a bimodal distribution of response amplitude corresponding to linear (black) and supralinear (red) summation. Inset: individual traces for a rCA3 EPSP, a MF EPSP and a summated supralinear EPSP. (d) Supralinear responses are suppressed by NMDAR blockade (D-AP5) resulting in a unimodal distribution of summated EPSP amplitudes. (e) Fluo-5F labelled CA3 pyramidal neuron. Fluorescence measurements to detect pairing-induced Ca2+ transients were obtained in three ROIs for apical dendritic branches in FOV 1 and five ROIs for basal dendritic branches in FOV 2. Lower right image shows localized Fluo-5F ΔF/F fluorescence change for one pairing trial (arrow in f). (f) Example Ca2+ transients from ROIs selected in e, recorded during 5/30 representative consecutive pairings (green bars). Trials with linear (‘−') and supralinear (‘+') EPSP summation are indicated. Ca2+ transients for FOV 2 were averaged separately for linear (n=14/30) and supralinear (n=16/30) trials. (g) NMDAR blockade abolished dendritic Ca2+ transients as shown for the same ROIs as in f. (h) A series of uniformly sized ROIs (∼1 × 1 μm) numbered from 1 to 20 were positioned along a responsive dendritic segment (delineated by arrows) as identified from the heat map in e. Images from three pairing trials in which an NMDA spike was evoked. (i) Ca2+ transients associated with an NMDA spike for ROI 8 and 11 (red traces) and for ROIs outside the active region (black traces) for the image in i marked with an asterisk. (j) The magnitude of LTP of the rCA3 EPSP correlates across cells with the incidence of Ca2+ transients during pairing (number of trials with Ca2+ transients in at least one ROI divided by the total number of ITDP pairings). In cells where the pairing protocol failed to evoke Ca2+ transients (green data points), EPSPs were not potentiated. Red data point corresponds to the example cell shown in d (r=0.79, n=16). (k) Pooled data showing the increase in NMDA spike amplitude as a function of the prevalence of dendritic Ca2+ transients (r=0.73, n=16).

