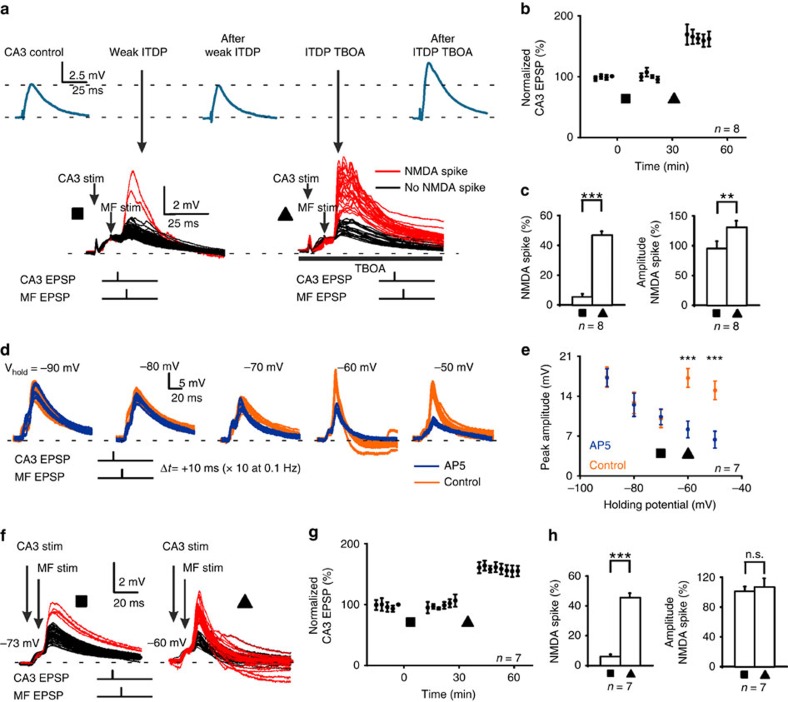
Figure 2. LTP induction can be manipulated bidirectionally by altering the probability of NMDA spikes.
(a) Representative example of voltage recordings during a weak ITDP protocol, which was below threshold for consistently evoking NMDA spikes and did not potentiate the rCA3 EPSP (top, blue traces). Increasing glutamate spillover with 10 μM TBOA during a second pairing protocol in the same cell enhanced the probability of NMDA spikes (red traces) and induced LTP (square: ITDP; triangle: ITDP + TBOA). (b) Pooled data for rCA3 EPSP amplitude after the weak ITDP protocol was applied in the absence and presence of TBOA (rCA3 EPSP amplitude was measured after TBOA washout). (c) Pooled data for the probability of evoking an NMDA spike and for the NMDA spike amplitude in the two conditions. (d) Decreasing NMDA spike probability by hyperpolarizing the membrane potential. An evoked rCA3 EPSP was paired with a subsequent MF EPSP at decrementing holding potentials with and without NMDAR blockade (D-AP5). For each condition, pairing was repeated only 10 times to avoid inducing LTP. (e) Pooled data show a linear decrease in summated EPSP amplitude during NMDAR blockade when the holding potential becomes more depolarized (blue traces). Repeating the experiment without NMDAR blockade reveals a nonlinear enhancement in EPSP amplitude at membrane potentials less negative than −70 mV (orange traces). (f) When the ITDP protocol was delivered at a hyperpolarized holding potential (more negative than −70 mV, square), where NMDARs do not contribute significantly to synaptic responses, NMDA spikes were rarely evoked. When the same protocol was repeated at −60 mV (triangle), NMDA spikes were evoked with high probability. (g) Time course of rCA3 EPSP amplitude showing that the ITDP protocol has no effect at −73 mV (square) but induces LTP at −60 mV (triangle). (h) Pooled data for NMDA spike incidence (6.1±1.5% versus 45.6±2.9%, n=7, P<0.001) and amplitude (101.3±4.9 versus 106.9± 11.8, n=7, P=0.68, paired t-test) for the two conditions.

