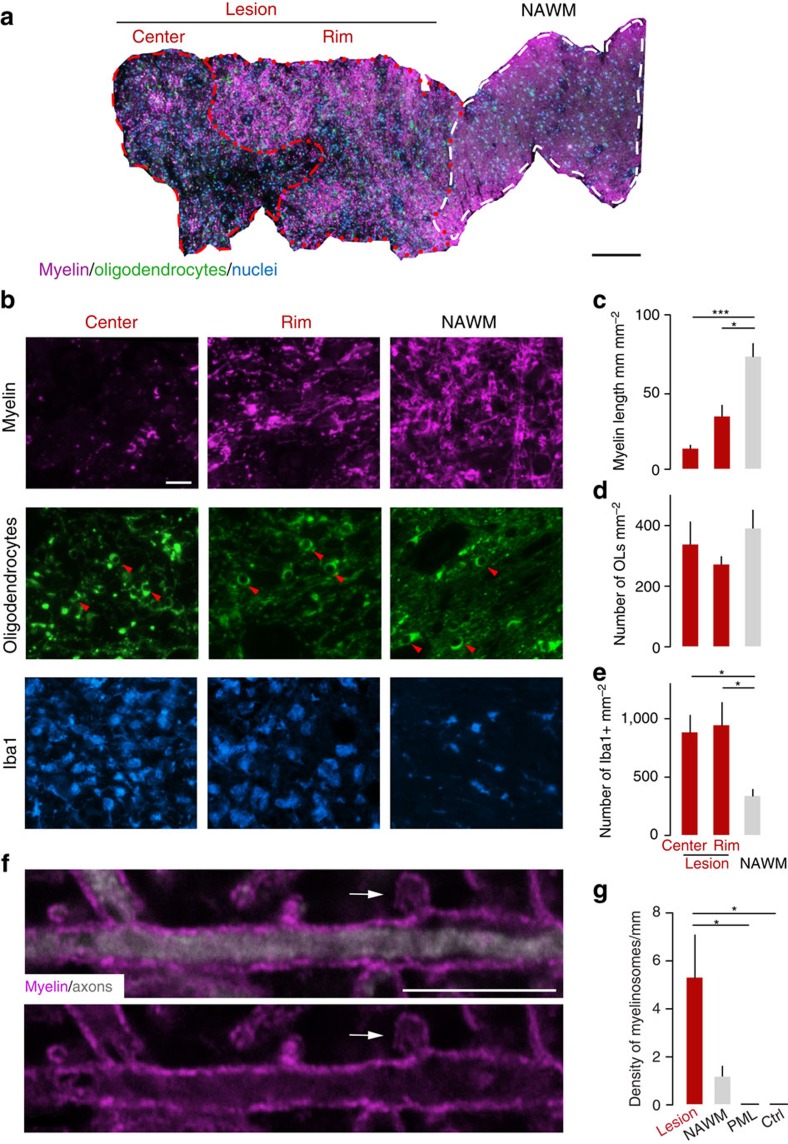
Figure 4. Oligodendrocyte pathology in actively demyelinating MS lesions spreads centripetally and involves myelinosome formation.
(a) Overview of a biopsy containing an actively demyelinating MS lesion stained for oligodendrocytes (NogoA, green), myelin (MBP, magenta) and nuclei (DAPI, cyan) that is segmented in three different areas, the lesion centre, lesion rim and normal-appearing white matter (‘NAWM'). (b) Higher magnification views from areas as defined in a (also stained for Iba1 to reveal the activation of mononuclear phagocytes, cyan). Arrowheads, oligodendrocyte somata. (c–e) Quantification shows loss of myelin (c; lesion centre, n=25 areas from 11 biopsies; rim of the lesion, n=15 areas from 11 biopsies and NAWM, n=10 areas from 4 biopsies), while oligodendrocyte density is preserved (d; lesion centre, n=23 areas from 11 biopsies; rim of the lesion, n=29 areas from 11 biopsies and NAWM, n=16 areas from 7 biopsies) in areas of phagocyte infiltration (e; lesion centre, n=5 areas from 3 biopsies; rim of the lesion, n=6 areas from 3 biopsies and NAWM, n=5 areas from 3 biopsies). (f) High-power view of a myelinosome (arrow; MBP, magenta; neurofilament, white) in an actively demyelinating MS lesion. (g) A comparably high density of myelinosomes is present in MS lesions, while only few are found in normal-appearing white matter in MS and none are detected in cases of PML or in controls without inflammatory CNS disease (‘ctrl', n=3 autopsy cases; NAWM, n=7 biopsies; MS lesion, n=7 biopsies; PML, n=4 autopsy cases). (a) Scale bar, 200 μm; (b) Scale bar, 20 μm; (f) Scale bar, 10 μm. *P<0.05; **P<0.01 (Kruskal–Wallis followed by Dunn's multiple comparison tests).

