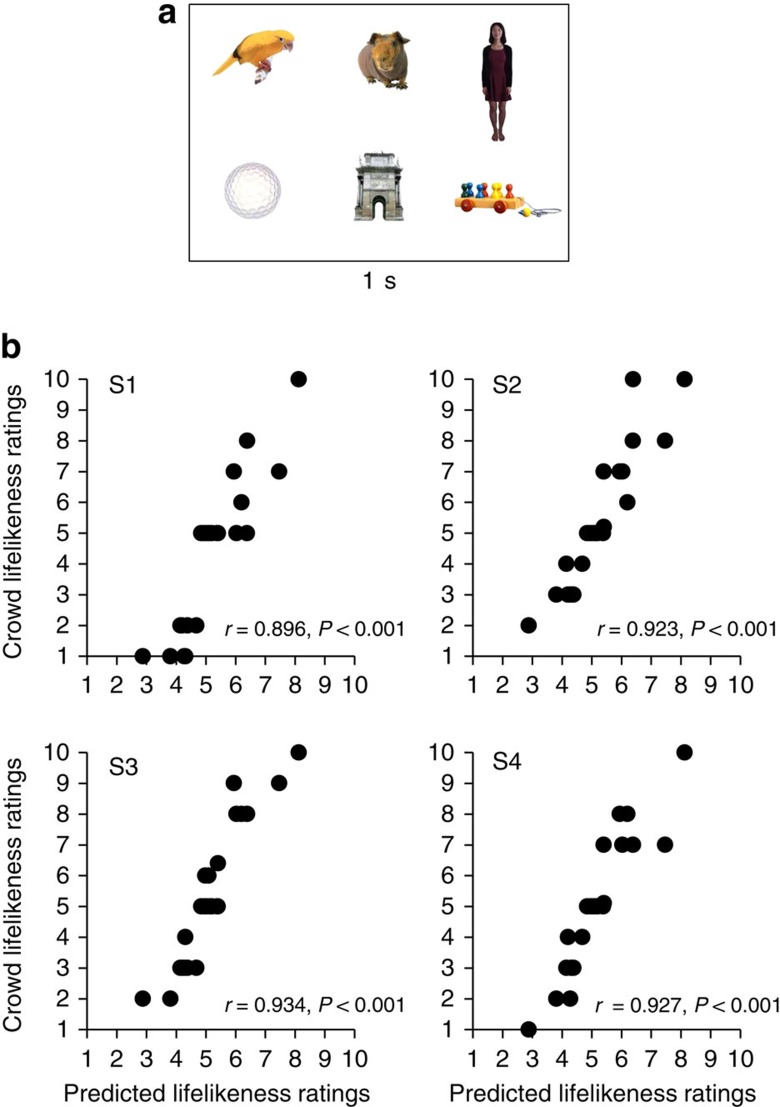
Figure 2. Experiment 2 stimuli and results.
(a) In the whole set condition, a display of six stimuli was presented for 1 s. Participants then rated the average lifelikeness of the group of stimuli using a slider bar. (b) Experiment 2 results for four representative subjects. The observers' ratings (black circles) of crowd lifelikeness (y axis) were well predicted by the average of individual item ratings derived from an independent group of observers in Experiment 1 (x axis), using a Pearson correlation, n=25.

