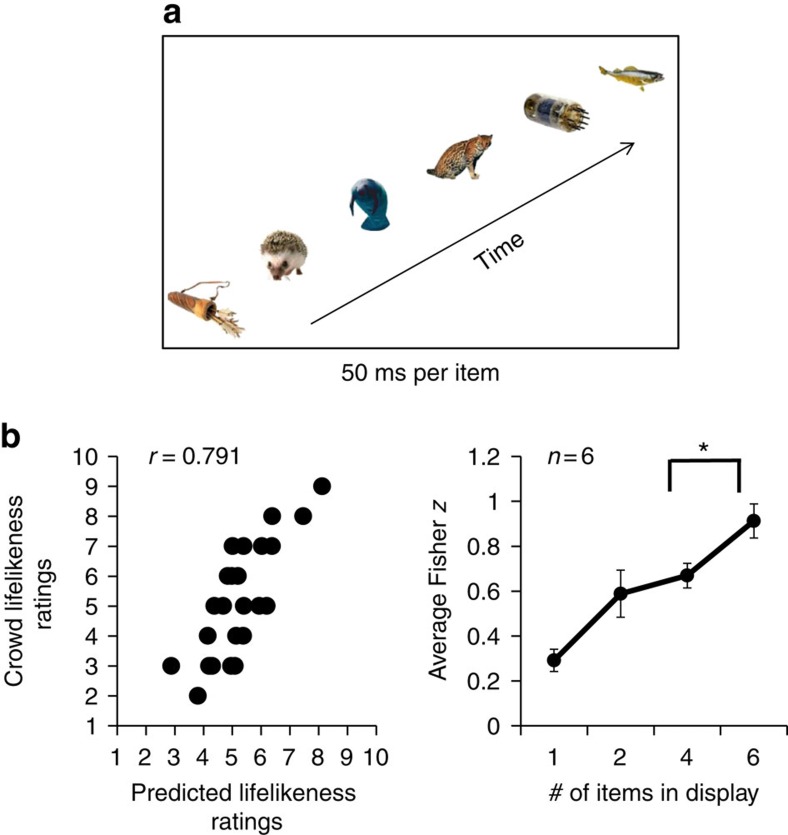
Figure 6. Example stimuli and results for Experiment 5.
(a) In the whole set condition, participants viewed groups of six stimuli, sequentially presented for 50 ms each. Participants then rated the average lifelikeness of the previously seen group. (b) Experiment 5 results. Left: Crowd lifelikeness of temporally presented groups is well predicted by the average of individual item ratings. This graph depicts the ratings (black circles) of one representative participant who judged 25 unique temporal crowds in the whole set condition. There is a high correlation between the ratings of average crowd lifelikeness (y axis) and predicted ratings of the crowds generated from single-item ratings (x axis), n=25. Right: Average results for six observers. The x axis represents the number of items displayed in the set. The y axis represents the magnitude of the Fisher z score. The Fisher z score in the whole set condition indicates that participants were able to perceive ensemble lifelikeness in sequentially presented groups of items. Moreover, Fisher z scores increase as the number of items displayed increases. This pattern rules out the possibility that participants engaged in random subsampling to accomplish the task. Error bars represent s.e.m.

