Figure 1. Aggregated size of gold structure.
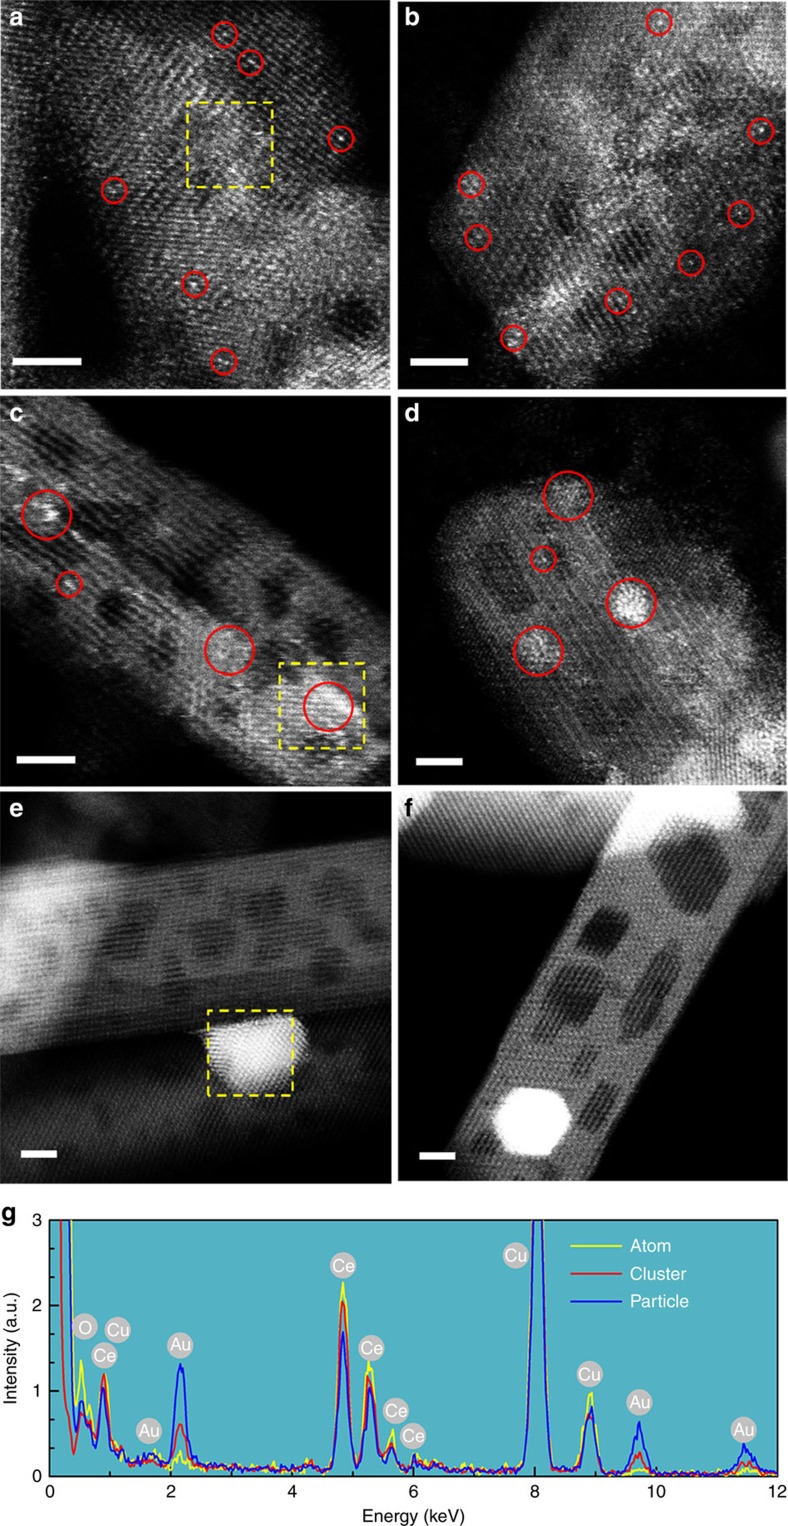
HAADF-STEM images of the gold-ceria samples (a,c,e) before and (b,d,f) after CO oxidation: (a,b) Au_atom; (c,d) Au_cluster; (e,f) Au_particle; (g) EDS data collected from selected areas in a,c and e. Red circles: typical Au single atoms or clusters; yellow boxes: X-ray EDS regions. Scale bars, 2 nm.

