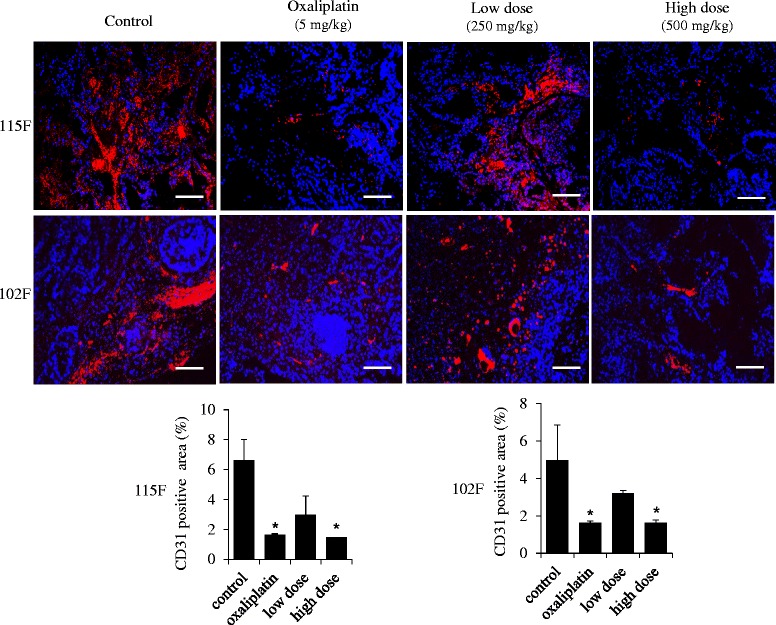
Fig. 5.

Suppression of angiogenesis by BP3B in PDTX model. To measure the status of tumor angiogenesis in BP3B-treated tumors, immunofluorescence analysis of CD31 was performed. CD31 positive cells were visualized into red and nuclei were stained with DAPI (blue). The intensity of image was quantified with ImmunoRatio software. Scale bars are 50 μm. * p < 0.05
