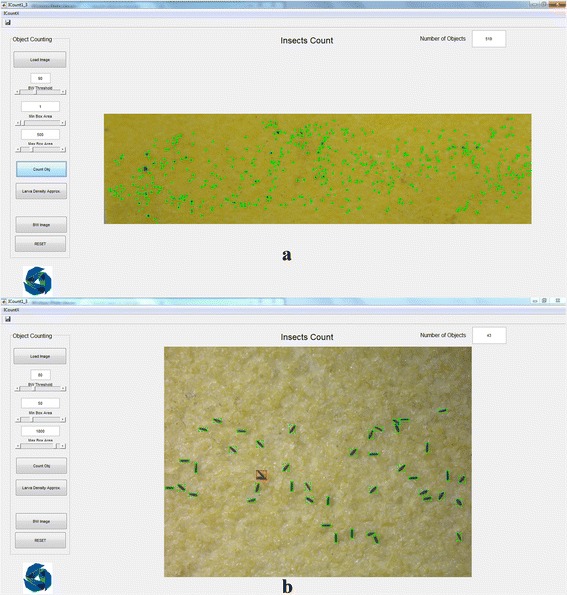
Fig. 2.

ICount interface with two types of image. a “Macro” image showing the overall sandpaper strip for “macro” analysis; it provides an estimation of the number of eggs laid employing colour histogram. b “Micro” image for “micro” analysis, providing a precise number of eggs laid via the snapshots taken under the microscope
