
Fig. 10.
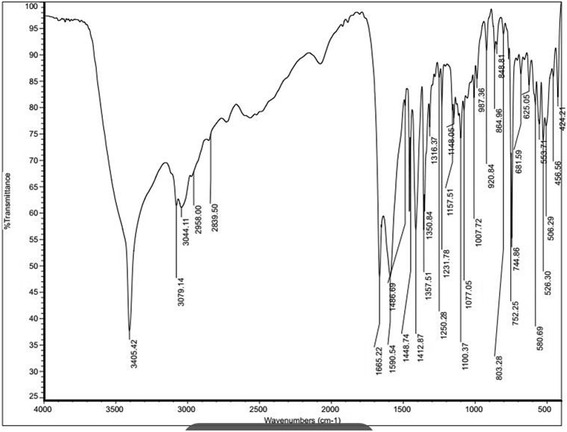
FTIR data with the presence of functional groups in the potent compound C1, frequency values appeared in the figures represent the respective functional groups
Official websites use .gov
A
.gov website belongs to an official
government organization in the United States.
Secure .gov websites use HTTPS
A lock (
) or https:// means you've safely
connected to the .gov website. Share sensitive
information only on official, secure websites.
FTIR data with the presence of functional groups in the potent compound C1, frequency values appeared in the figures represent the respective functional groups