
Fig. 6.
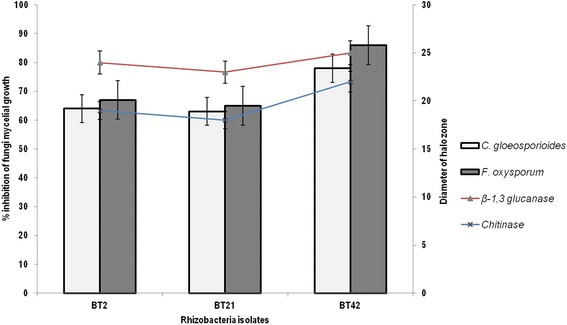
Percent inhibition of mycelial growth of C. gloeosporioides and F.oxysporum (Bar graph) and production of lytic enzymes (line graph) by selected Bacillus species isolates
Official websites use .gov
A
.gov website belongs to an official
government organization in the United States.
Secure .gov websites use HTTPS
A lock (
) or https:// means you've safely
connected to the .gov website. Share sensitive
information only on official, secure websites.
Percent inhibition of mycelial growth of C. gloeosporioides and F.oxysporum (Bar graph) and production of lytic enzymes (line graph) by selected Bacillus species isolates