
Figure 2.
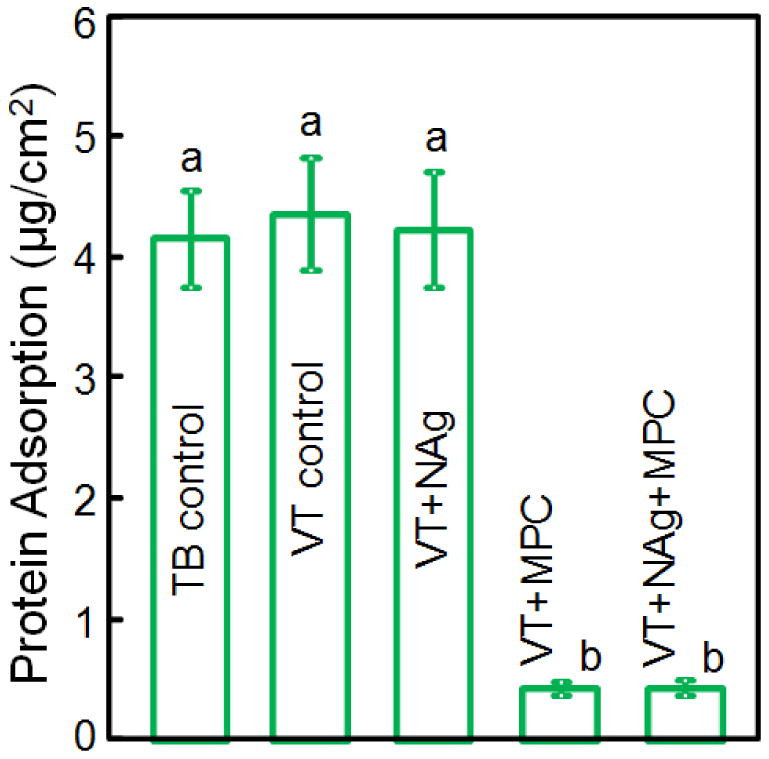
Protein adsorption onto sample surfaces (mean ± sd; n = 6). VT with 3% MPC and VT with 0.1% NAg + 3% MPC both had much less protein adsorption, which was about 1/10 that of commercial controls (p < 0.05). Bars with dissimilar letters indicate values that are significantly different from each other (p < 0.05).