Fig. 4.

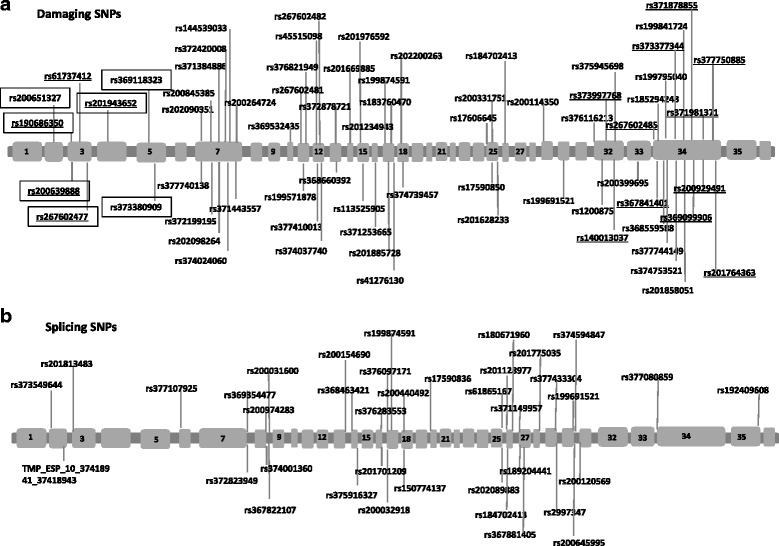
Graphical representation of location of NY-BR-1 SNPs. a) damaging SNPs, b) splicing SNP. SNPs predicted damaging by all three tools are underlined and SNPs located in an ANK repeat domain are highlighted with a box

Graphical representation of location of NY-BR-1 SNPs. a) damaging SNPs, b) splicing SNP. SNPs predicted damaging by all three tools are underlined and SNPs located in an ANK repeat domain are highlighted with a box