Fig. 3.

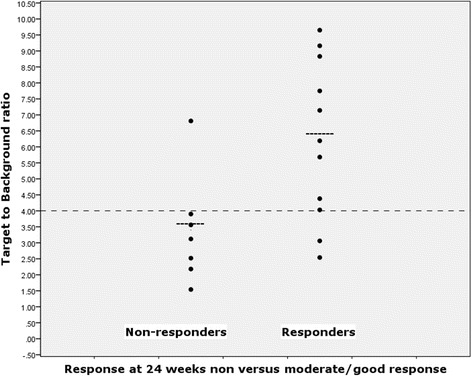
Target-to-background ratios of positron emission tomography (PET)-positive joints in relation to clinical response, in those patients who had at least one PET-positive joint on visual interpretation

Target-to-background ratios of positron emission tomography (PET)-positive joints in relation to clinical response, in those patients who had at least one PET-positive joint on visual interpretation