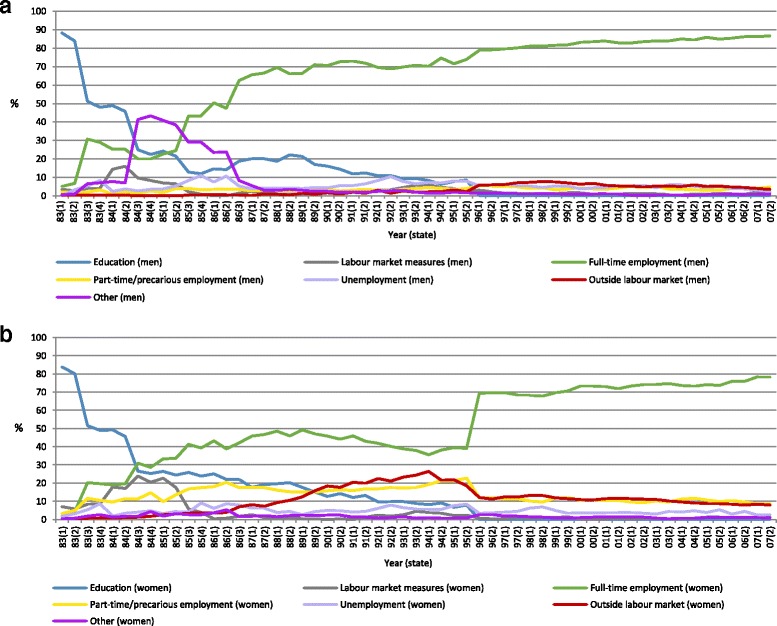
Fig. 1.

a. The distribution of the seven categories of labour market attachment among men (n = 492), 1983–2007 (ages 18–42). b. The distribution of the seven categories of labour market attachment among women (n = 463), 1983–2007 (ages 18–42)

a. The distribution of the seven categories of labour market attachment among men (n = 492), 1983–2007 (ages 18–42). b. The distribution of the seven categories of labour market attachment among women (n = 463), 1983–2007 (ages 18–42)