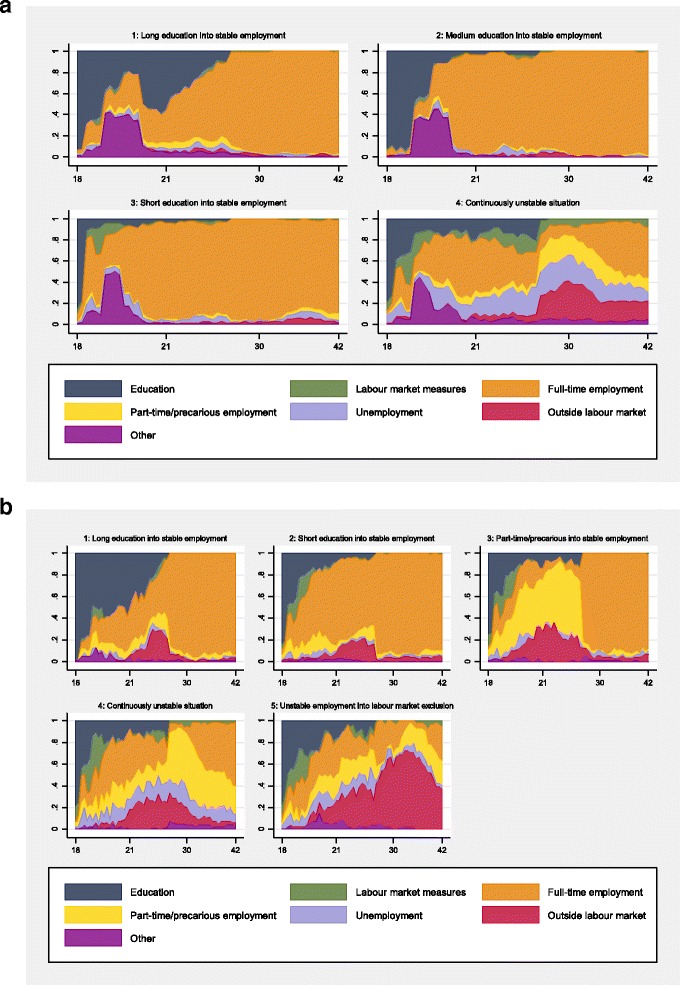
Fig. 2.

a. Typical trajectories of education and labour market attachment among men (n = 492), across ages 18–42 (1983–2007). Note: Trajectory 1: 29.1% (n = 143); Trajectory 2: 22.2% (n = 109); Trajectory 3: 31.5% (n = 155); Trajectory 4: 17.3% (n = 85). Y-axis shows the proportion of individuals, x-axis shows age. b. Typical trajectories of education and labour market attachment among women (n = 463), across ages 18–42 (1983–2007). Note: Trajectory 1: 18.1% (n = 84); Trajectory 2: 37.4% (n = 173); Trajectory 3: 15.6% (n = 72); Trajectory 4: 17.3% (n = 80); Trajectory 5: 11.7% (n = 54). Y-axis shows the proportion of individuals, x-axis shows age
