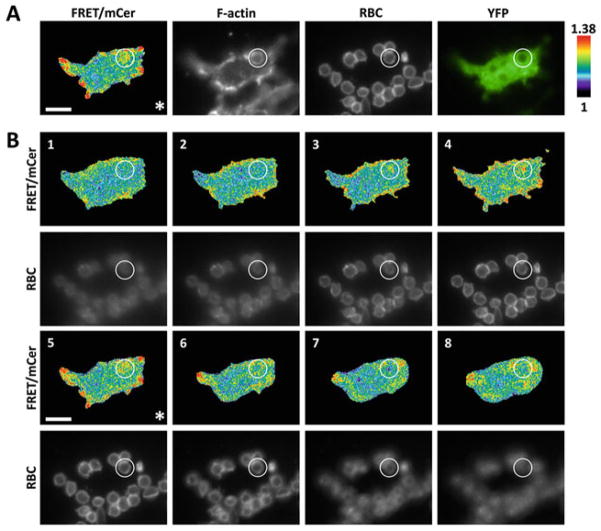
Fig. 1.
Cdc42 activity over a stack of Z-serial planes containing a developing phagosome. RAW/LR5 cells transiently expressing the Cdc42 biosensor were imaged (a) at optimal F-actin focal plane and (b) in Z-series at 1 μm-steps where the focal plane from A was set as the center (*). Planes 4-1 progress down towards the base of the phagocytic cup and below, while planes 6–8 move upwards from the F-actin plane. FRET/mCerulean ratio image, phalloidin staining of F-actin, red blood cell (RBC) staining and YFP for biosensor localization are shown; representative image set of n = 6 cells. Scale bar = 10 μm. Modified from Hanna et al. [12]

