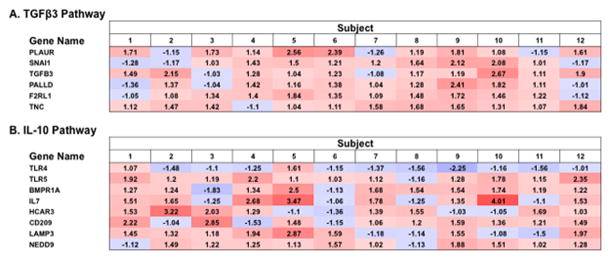
Figure 2.
Predicted upstream activation of TGF-β3 (A) and IL-10 (B) pathways. Shown are ratios of end of treatment (EOT, week 20) over pre-treatment (PRE) gene expression, with red representing increased post-treatment gene expression, blue representing decreased gene expression, and ratio indicated in each field. TGF-β3 and IL-10 pathways had an Ingenuity Pathway Analysis (IPA) activation Z-scores 2.4 and 2.2, respectively.

