
Figure 9.
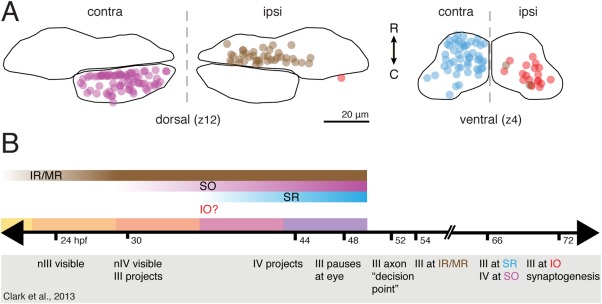
Spatiotemporal organization of extraocular motoneurons in nIII and nIV. (A) Aggregate figure showing relative locations of nIII/nIV motoneurons at two exemplar planes; data from Figs. 6, 7. (B) Comparison of motoneuron subpopulation birthdates (gradient bars) with development landmarks (Clark et al., 2013) from live imaging of extraocular motoneuron projections (timeline markers; events inside gray box). Solid color bars = periods between BAPTISM initial photoconversion timepoints.