Fig 1.

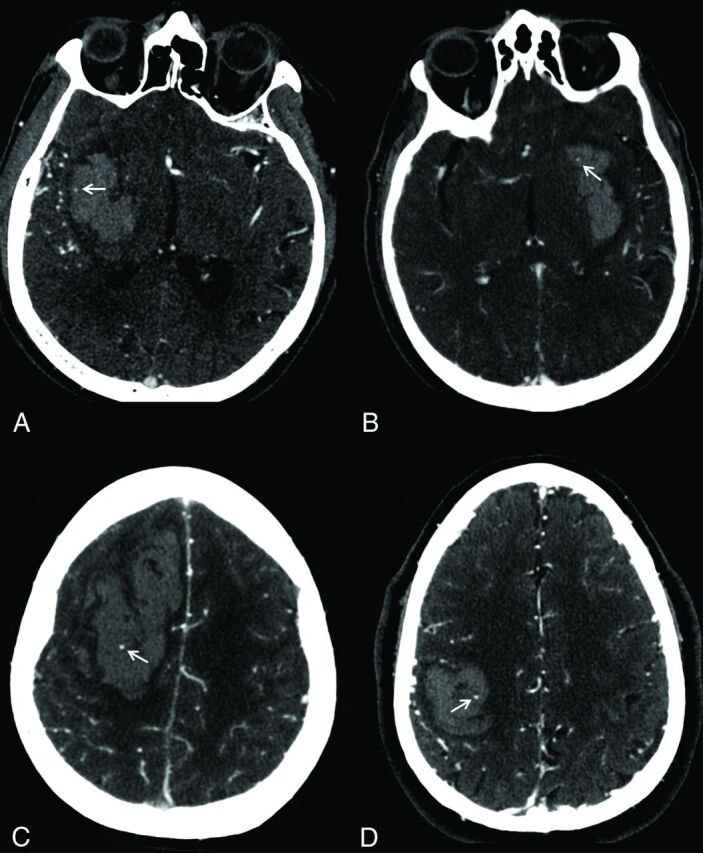
Appearance of the spot sign (arrows) on CTA images obtained at low tube current (A, 170 mA; B, 235 mA) versus high tube current (C, 350 mA; D, 350 mA). All images were acquired on the same scanner at 120 kVp.

Appearance of the spot sign (arrows) on CTA images obtained at low tube current (A, 170 mA; B, 235 mA) versus high tube current (C, 350 mA; D, 350 mA). All images were acquired on the same scanner at 120 kVp.