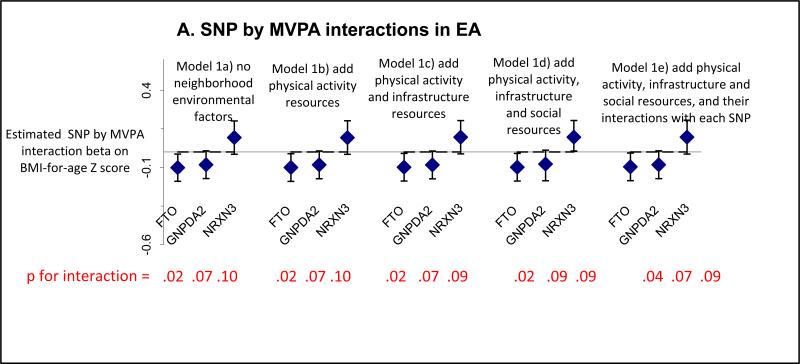
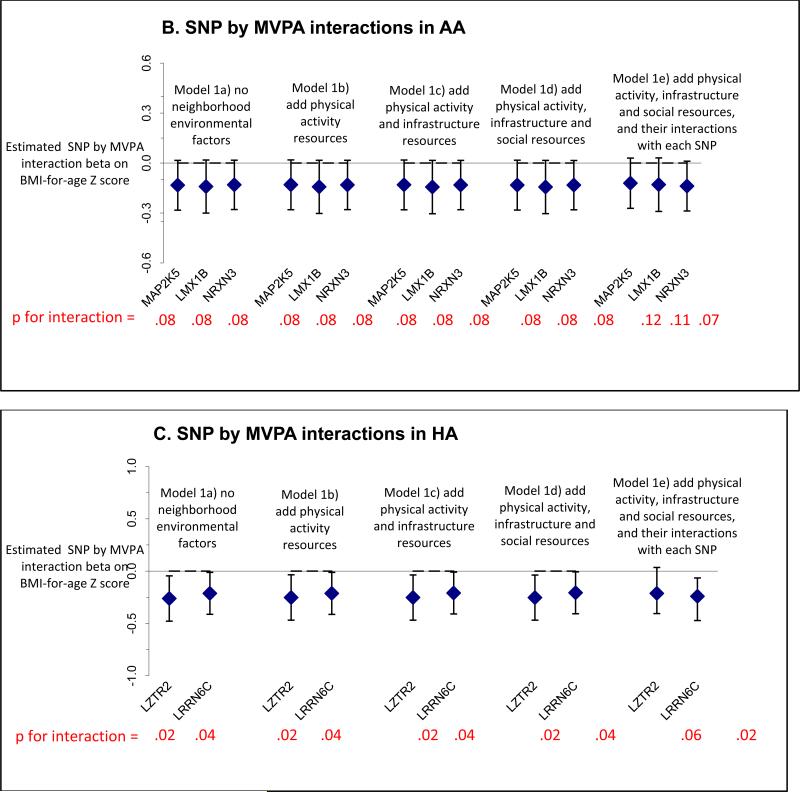
Figure 1.
The estimated interaction effects for moderate to vigorous physical activity (MVPA) with the indicated SNPs by race/ethnicity (A. European ancestry [EA], B. African ancestry [AA], C. Hispanic ancestry [HA]) on BMI-for-age Z-score, before and after adjusting for neighborhood environmental factorsa.
Abbreviations: EA: European Americans; AA: African Americans: HA: Hispanic Americans a The 3 categories of neighborhood environmental factors are defined as follows: 1) physical activity resources, which included counts of physical activity facilities, parks, public facilities such as community centers, pay facilities such as golf courses and health centers; 2) transportation and recreation infrastructure (labeled in the graphs as infrastructure resources), which included counts of cul-de-sacs, green space (the proportion of undeveloped land that is either natural or recreational, derived from the U.S. Geological Service's National Land Cover Dataset based on Fragstats [version 3.3 build 5] from 1992 for Wave I and from 2001 for Wave III), and alpha index (ratio of observed to maximum possible route alternatives between street nodes), with higher values of each indicating greater walkability; and 3) a set of neighborhood social characteristics variables (labeled in the graphs as social resources), which included crime rates per 100,000 population within the county, and the percent of persons <150% of federal poverty level (1.5*federal poverty level [U.S. Census Bureau 2009]). Further details about the methods used can be found elsewhere [Boone et al Health Place. 2010]. All models include the SNP by MVPA interaction with the indicated SNP. Model 1a only included the SNP by MVPA interaction without any of the neighborhood environmental factors and serves as the baseline model for comparison. Subsequent models build upon Model 1a. Model 1b adjusted for physical activity resources. Model 1c adjusted for physical activity resources and neighborhood infrastructure resources. Model 1d adjusted for physical activity resources, neighborhood infrastructure resources, and neighborhood social resources. Model 1e included the interactions of physical activity resources, neighborhood infrastructure resources, and neighborhood social resources with the respective SNP.


