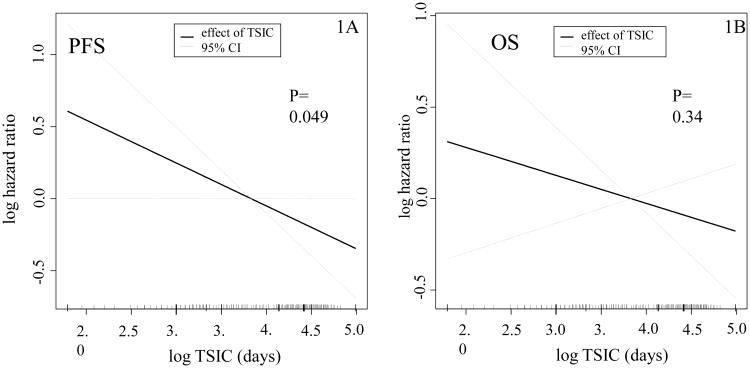
Figure 1.
Plot of the partial effect of TSIC on the log hazard ratio of the progression-free (1A) and overall survival models (1B) in GOG 114 and GOG 172. These are the plots of the partial effect of log TSCI on the log hazard ratio of PFS (1A) and OS (1B) models, respectively. They represent the risk contribution of continues variables (TSCI) in a survival model.

