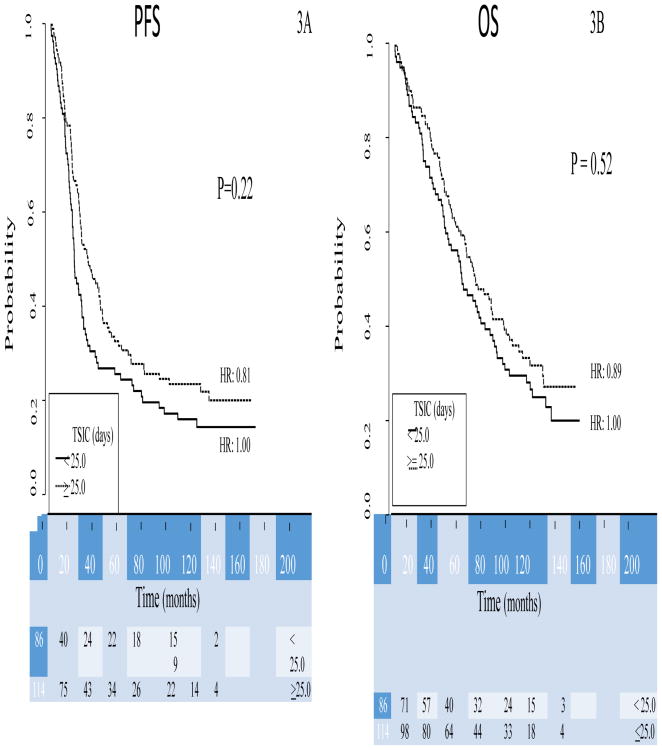
Figure 2.
Kaplan–Meier curves of progression-free (2A) and overall (2B) survival for study patients from GOG-0172, stratified by TSIC groups. The TSIC groups are those patients that received IP chemotherapy under IP arm of GOG 172 prior to 25 days from surgery and those that received it in or after 25 days from surgery. Figures below months indicate the numbers of patients at risk. The p-value is from the Wald test to compare hazard ratios between the subgroups in the multivariate model.

