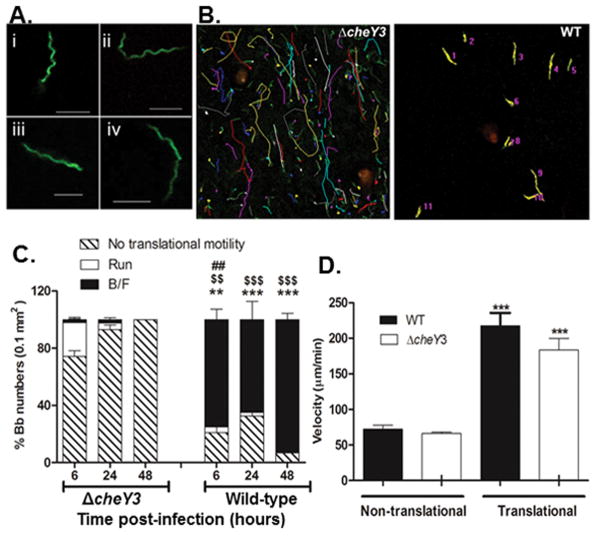
Figure 5. Comparison of motility patterns in murine ear tissue between ΔcheY3 and WT.
A. Morphology of WT and ΔcheY3 B. burgdorferi was observed in vivo in ear skin tissue of mouse using intravital microscopy technique. 1×10⁶ WT-eGFP or ΔcheY3-eGFP B. burgdorferi was injected intradermally into ear skin and images were collected between 2-6 hours post-injection. Both WT (i–ii) and ΔcheY3 (iii–iv) bacteria demonstrate similar characteristic flat-wave morphologies in vivo. Scale bar is 5μm. B–C. 1×10⁶ WT-eGFP or ΔcheY3-eGFP B. burgdorferi (Bb) were injected as above and time-lapse images were collected at different times post-injection. B. Representative images of ΔcheY3 (left) and WT (right) motility path tracked at 6h post-injection using MetaMorph. Colored lines (except green) are the tracks of the bacteria. C. For both strains, the % bacteria performing run, back-and-forth (B/F) and no translational motility was calculated. The majority of WT bacteria at all times performed B/F, whereas most of the ΔcheY3 bacteria were non-translational. The translating ΔcheY3 performed mainly runs with occasional stops, rather than B/F. Results show average % motility ± SEM. ## p = 0.003 % run compared to ΔcheY3; $$ p = 0.0026, $$$ p ≤ 0.0003 % B/F compared to ΔcheY3; ** p = 0.0057, *** p ≤ 0.006 % no translational motility compared to ΔcheY3. Statistics were performed using the Mann Whitney test. n ≥ 3 mice. D. The velocity of WT and ΔcheY3 was measured at 6h post-injection using MetaMorph. Results show average ± SEM. ***p<0.0001 compared to the non-translational counterparts; Statistics were performed using the Mann Whitney test. n ≥ 30 bacteria under each bar.

