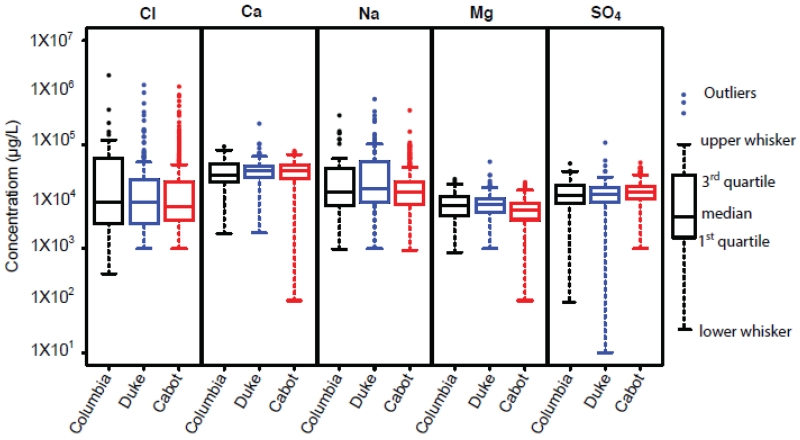
Figure 1.
Boxplots of concentration of five major constituents (Cl. SO4, Ca, Na, and Mg) in three studies. The upper whisker is the maximum observation below upper fence (1.5 IQR above 3rd quartile) and the lower whisker is the minimum observation above lower fence (1.5 IQR below 1st quartile). IQR is the interquartile range, a distance between 3rd and 1st quartiles.

