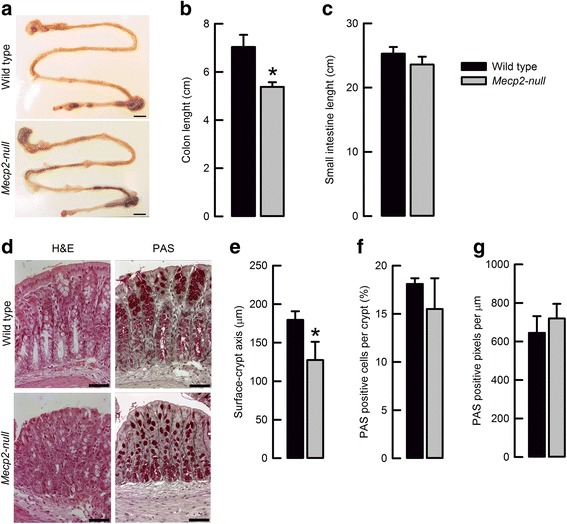
Fig. 2.

Mecp2 deletion produces changes on colon morphology and histology. a Representative images of intestinal morphology (bar 1 mm). b Summary of average colon and c small intestine length from wild-type and Mecp2-null mice.*P < 0.05 vs. wild-type (n = 6 each genotype). d Representative images of histology H&E staining (upper) and PAS staining (lower) (bar 25 μm). e Surface–crypt axis measurements of wild-type and Mecp2-null colon samples. *P < 0.05 vs. wild-type (n = 6 for each genotype). f PAS-positive cells and g PAS-positive pixels in wild-type and Mecp2-null colon samples (n = 6 for each genotype)
