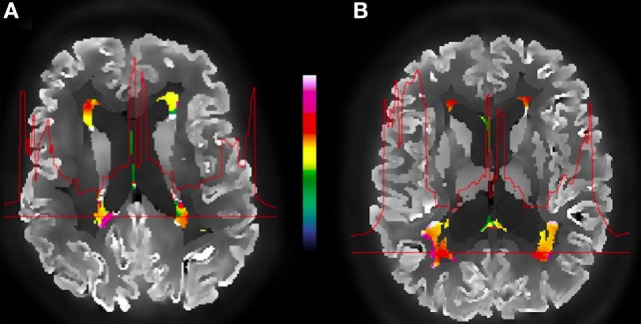
Figure 3.

Example of an amyloid-positive (A) vs. amyloid-negative (B) subject and the corrected FDG-PET images, WMH segmentation (color), and the metabolic profile (red line) for the selected WMH section across the brain. The color bar indicates normalized relative uptake.
