
FIGURE 7.
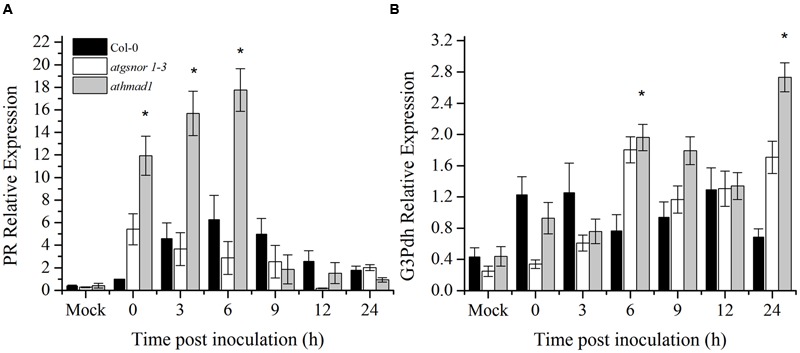
Transcript accumulation of genes involved in SAR. Expression level of (A) the PR gene and (B) G3Pdh (Glycerol-3-phosphate dehydrogenase) following attempted Pst DC3000 (avrB) infiltration at 5 × 10⁵ CFU. Leaf samples were collected from systemic leaves at various intervals over 24 hpi. 0 hpi represents samples collected immediately after pathogen inoculation. The experiment was repeated three times with similar results. All the data was analyzed statistically using analysis of variance (P < 0.05) followed by Standard Error. Error bars represent ± SE (n = 3). Asterisks represent significant differences compared to WT plants, (Student’s t-test with a 95% confidence level).