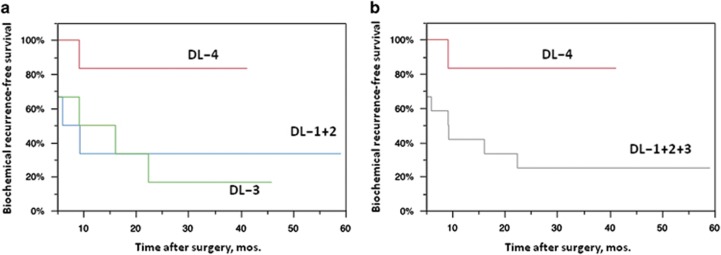
Figure 5.
Kaplan–Meier curves representing biochemical recurrence-free survival (BRFS) in patients with high-risk prostate cancer treated with neoadjuvant Ad-REIC followed by radical prostatectomy. (a) BRFS curves of three dose level groups. The differences were not significant (P=0.101, log-rank test). (b) BRFS curves of DL-1, -2 and -3 pooled group and DL-4 group. The difference was significant (P=0.034, log-rank test).

