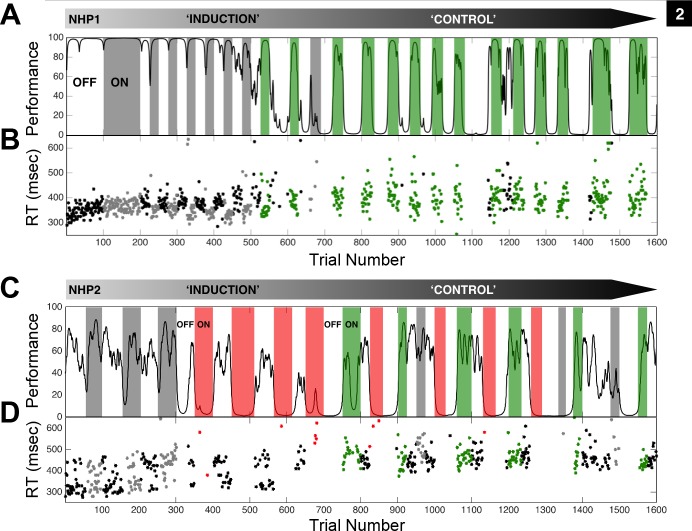
Fig. 2.
Central thalamic deep brain stimulation markedly affects the animal's performance on the vigilance task. A: the performance estimate of NHP1 on repeated trials of the vigilance task is shown as a smoothly varying black line. Performance was estimated from correct and incorrect trial completion (Smith et al. 2009) and only the first 1,600 (154 min) of 2,500 (230 min) trials in this example session are shown. Periods of continuous fsCT-DBS are colored according to significant behavioral facilitation (green) and nonsignificant change in behavioral performance (gray) based on the LOR value (P < 0.05) for each period. The same anode-cathode configuration, right caudal cathode contact 0, rostral anode contact 0, and stimulation amplitude of 1.75 mA was used in all periods shown. Two segments of contiguous trials labeled “induction” and “control” represent phases of behavioral change that occurred during the ON and OFF fsCT-DBS paradigm. Note the general decline in average performance during the “induction” phase, and then the eventual “control” of performance, established after trial 700 (73 min). B: reaction times (RT) of correct trials during fsCT-DBS ON periods are colored as in A and black during OFF periods. C: the performance estimate of NHP2 on repeated trials of the vigilance task. The same anode-cathode configuration, bilateral caudal cathode contact 4, rostral anode contact 4 was used throughout; however, significant facilitation (green) of performance was observed when stimulation amplitudes ranged from 0.5 to 1.0 mA and consistent behavioral suppression (red) was observed when stimulation amplitudes ranged from 1.5 to 3.0 mA. A similar decline in average performance is seen during the “induction” phase and with a lesser degree of “control” established after trial 700 (66 min) to trial 1600 (147 min). D: RT of correct trials during fsCT-DBS ON periods are colored as in C and black during OFF periods.

