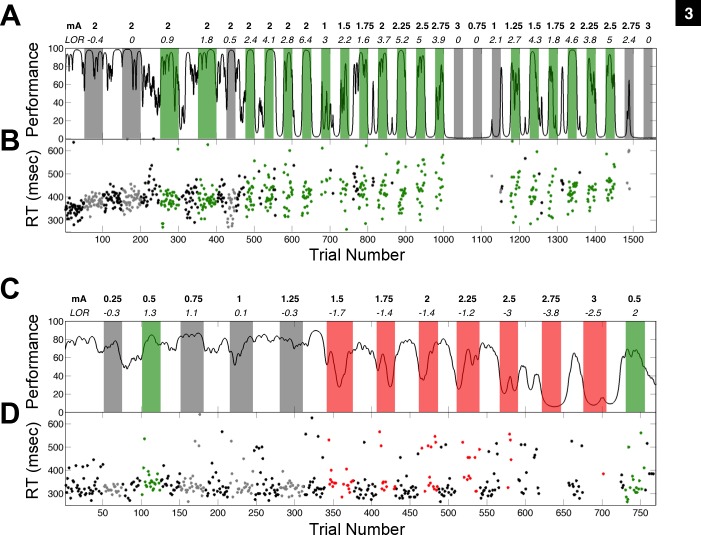
Fig. 3.
The relationship between the amplitude of central thalamic deep brain stimulation and the animal's performance on the vigilance task. A: the performance estimate of NHP1 on the vigilance task is shown as a smoothly varying black line (Smith et al. 2009). Periods of continuous high-frequency fsCT-DBS are colored according to the significance of the LOR value (P < 0.05) for each period: behavioral facilitation in green, behavioral suppression in red. and gray for no significant change in performance. Stimulation amplitudes, ranging 0.75 to 3.0 mA, are noted above each fsCT-DBS period along with the LOR value. The same anode-cathode configuration, right caudal cathode contact 0, rostral anode contact 0 was used throughout. Note that once “control” of performance was established after trial 500 (57 min), stimulation amplitudes between 1.25 and 2.5 robustly facilitated performance while amplitudes below and above this range had little or no effect on performance. B: reaction times occurring within fsCT-DBS ON periods are colored as in A and black during OFF periods. C: Same as in A, but for NHP2. In this session, fsCT-DBS stimulation amplitudes of 1.5 mA and above significantly suppressed performance while amplitudes between 0.25 and 1.25 mA had either no effect or modestly facilitated behavioral performance. The same anode-cathode configuration, left caudal cathode contact 4, rostral anode contact 4 was used throughout. D: same as in B, but for NHP2. In both animals stimulation amplitude markedly influenced behavioral performance where low and high amplitudes had either no effect or significantly suppressed performance (LOR, P < 0.05) and where amplitudes in-between facilitated performance, demonstrating an inverted-U relationship between stimulation amplitude and performance (Mair et al. 2008; Yerkes and Dodson 1908).

