Fig. 6.
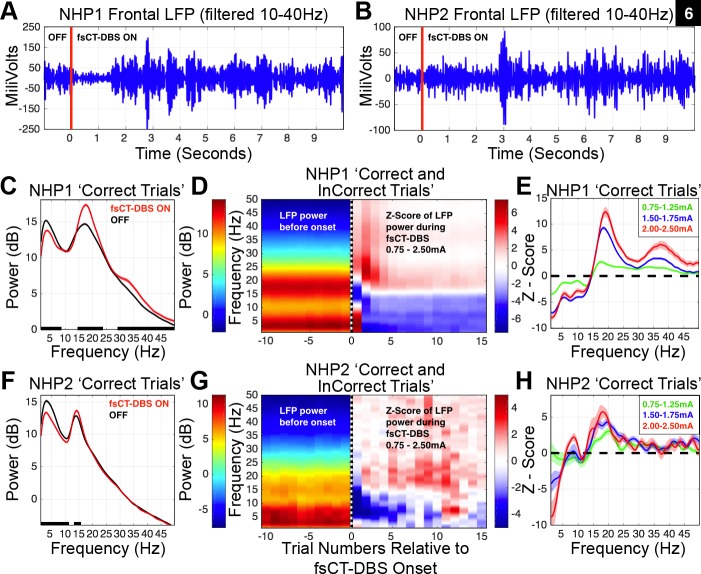
Field shaping CT-DBS markedly shifts power spectra of local field potentials measured in frontal and striatal regions. A: a band-pass filtered, 10–40 Hz, LFP recorded from the frontal cortex of NHP1. The onset of high frequency (200 Hz) 2.0-mA fsCT-DBS is marked by the red line at 0 s. B: same as in A, but for NHP2. fsCT-DBS amplitude was 1.5 mA. C: average power spectra of an LFP recorded from the frontal cortex of NHP1, restricted to the delay period of correctly performed trials, 481 fsCT-DBS ON trials and 886 fsCT-DBS OFF trials, averaged across 22 fsCT-DBS periods from one experimental session. Black points along the bottom of the frequency axis indicate significant difference between power spectra [two-group test, P < 0.05 (Bokil et al. 2007), false discovery rate, P < 0.05 (Benjamini and Hochberg 1995)]. D: left-side is average LFP power and right-side is average Z-score of LFP power (see methods) concatenated over 10 trials prior to fsCT-DBS onset, indicated by dashed vertical line at trial 0, and 15 trials during fsCT-DBS. The average 2-D spectrograms include LFP activity recorded from 2,577 frontal and striatal sites, aggregated over 1,423 fsCT-DBS periods conducted in 154 experimental sessions in NHP1. Stimulation amplitudes ranged from 0.75 to 2.5 mA and frequencies of 150, 175, 200 and 225 Hz. E: average Z-scores of LFP power spectra shown in D, but during the delay period of Correct trials during fsCT-DBS ON periods (19,349 trials, 283,423 spectra), relative to delay period activity of Correct trials during fsCT-DBS OFF periods (19,320 trials, 298,216 spectra), including ±95% CI. The Z-score power spectra for each LFP site was corrected for unequal trial numbers between the two conditions (two-group test, P < 0.05) and corrected for multiple comparisons across the frequencies in the spectra (false discovery rate, P < 0.05) prior to averaging. Z-scores are grouped according to a range of stimulation amplitudes, 0.75–1.25, 1.50–1.75, and 2.0–2.5 mA. F: same as in C, but for NHP2. 338 fsCT-DBS ON trials and 577 fsCT-DBS OFF trials, averaged across 17 fsCT-DBS periods from one experimental session. G: same as in D, but for 60 frontal LFP sites recorded in NHP2. The average plots include LFP activity aggregated over 143 fsCT-DBS periods across 15 sessions. Stimulation amplitudes ranged from 0.75 to 2.5 mA and frequencies of 150, 175, 200, and 225 Hz. H: same as in E, but for 60 frontal LFP sites recorded in NHP2 and during the delay period of Correct trials during fsCT-DBS ON periods (1,581 trials, 6,130 spectra), relative to delay period activity Correct trials during fsCT-DBS OFF periods (4,122 trials, 6,385 spectra), including ±95% CI.

