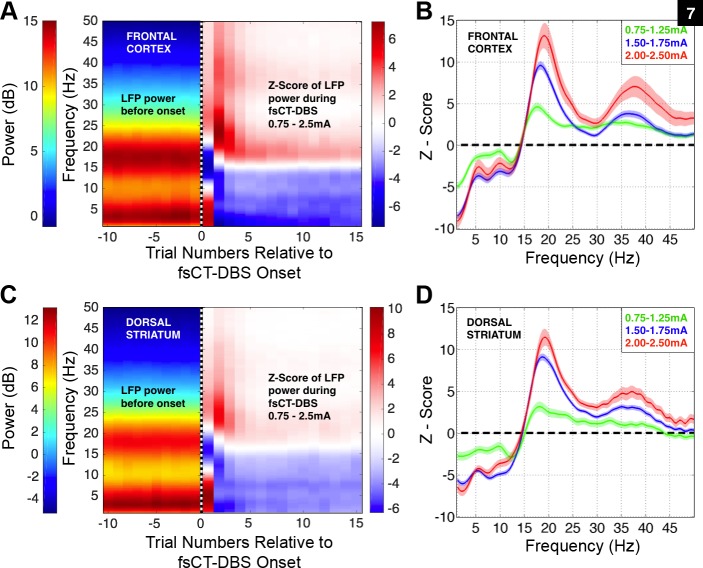
Fig. 7.
Field shaping CT-DBS markedly shifts power spectra of local field potentials measured across various regions within the frontal cortex and dorsal striatum in NHP1. A: left-side is average LFP power and right-side is average Z-score of LFP power (see methods) concatenated over a series of 10 trials prior to fsCT-DBS onset, indicated by dashed vertical line at trial 0, and 15 trials during fsCT-DBS. LFP activity was recorded from 1,305 sites within the frontal cortex and is aggregated over 1,325 fsCT-DBS periods conducted in 144 experimental sessions. Stimulation amplitudes ranged from 0.75 to 2.5 mA and stimulation frequencies of 150, 175, 200, and 225 Hz were included. Field shaping CT-DBS was established with cathode(s) set on the caudal DBS lead contacts 0, 1, and/or 2 and anodes(s) set on the rostral DBS lead contacts 0, 1, and/or 2. B: average Z-score of the LFP power spectra shown in A, but during the delay period of Correct trials during fsCT-DBS ON periods, relative to the delay period activity of Correct trials recorded during fsCT-DBS OFF periods, including ±95% CI. The Z-score power spectra for each LFP site was corrected for unequal trial numbers between the two conditions (two-group test, P < 0.05) and corrected for multiple comparisons across the frequencies in the spectra (false discovery rate, P < 0.05) prior to averaging. Z-scores are grouped according to three sets of stimulation amplitudes, 0.75–1.25, 1.50–1.75, and 2.0–2.5 mA. C: same as in A, but for LFP activity recorded from 1,024 sites within the dorsal striatum and aggregated over 1,009 fsCT-DBS periods conducted in 121 experimental sessions. D: same as in B, but for the LFP power spectra shown in C that was recorded within the dorsal striatum.

