Figure 4.

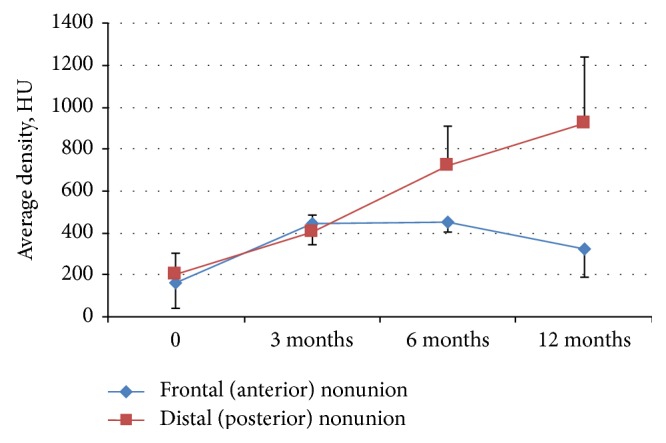
Average density in the regions of nonunions (0) and the sites of gene-activated bone substitute implantation in 3, 6, and 12 months after surgery.

Average density in the regions of nonunions (0) and the sites of gene-activated bone substitute implantation in 3, 6, and 12 months after surgery.