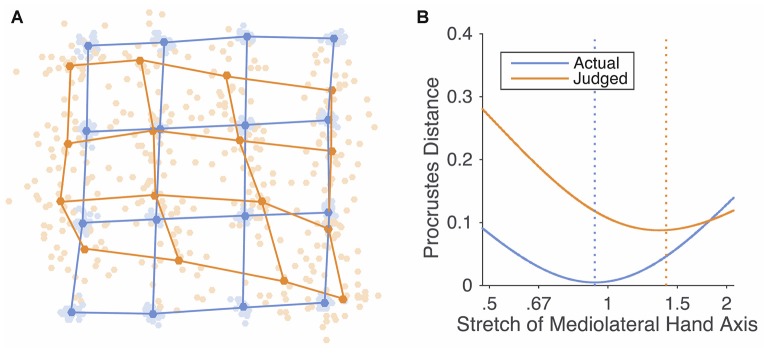
Figure 4.
(A) Generalized Procrustes alignment of the actual configuration of points on the hand (blue dots and lines) and perceptual maps (orange dots and lines). The light dots are data from individual participants, while the dark dots represent the average shape. (B) Mean Procrustes distance between actual and perceptual maps and idealized grids stretched by different amounts. A stretch of 1 indicates a square grid; stretches greater than 1 indicate stretch in the medio-lateral axis, while stretches less than 1 indicate stretch in the proximo-distal axis.

