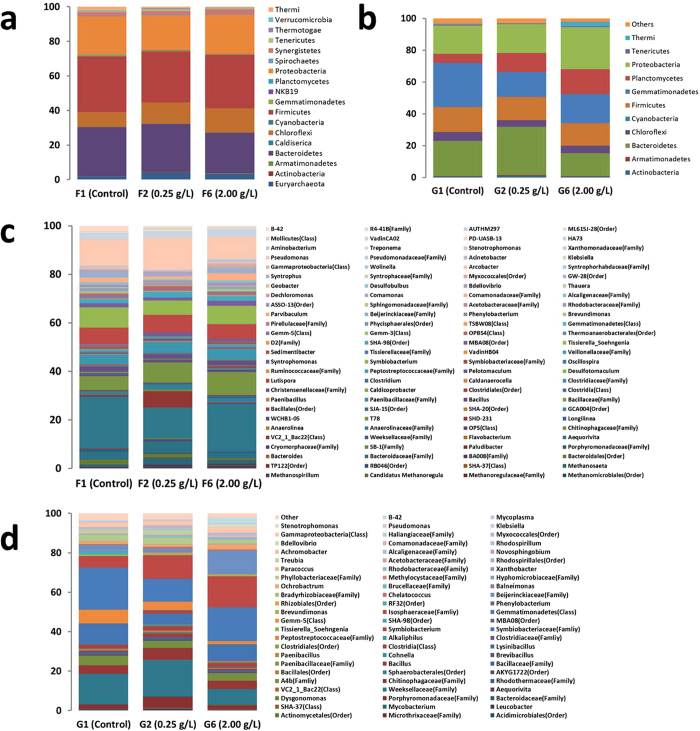
Figure 3. Relative read abundance of different bacterial community structure at phylum and genus levels in different treatments.
(a) Distribution of bacterial phyla (abundance ≥ 0.1%) in F1, F2 and F6 UASB reactors; (b) Distribution of bacterial phyla (abundance ≥ 0.1%) in G1, G2 and G6 SBR reactors; (c) Distribution of bacterial genera (abundance ≥ 0.1%) in F1, F2 and F6 UASB reactors; and (d) Distribution of bacterial genera (abundance ≥ 0.1%) in G1, G2 and G6 SBR reactors.

